
The Good, the Bad, and the Rock Fights: Cal at Leland Stanford Junior University 2025
Our final Good-Bad-Rockfights analysis in its current form before pivoting to a post-Wilcox Era analytic approach next week.


Welcome back to The Good, the Bad, and the Rockfights, our weekly exercise in making sense of what we saw on the field this past weekend. At its best, this series dives into data to uncover hidden nuance within the team’s performance, ultimately leading to some unique insight. At its worst, we use advanced analysis to confirm the astoundingly obvious (but we still have fun and look at pretty graphs, so it’s a worthwhile exercise). After watching one half of the offense doing absolutely nothing followed by a second half of both units doing absolutely nothing, I was expecting this to be a clear-cut case of The Bad. It certainly felt that way while watching, although the emotional toll of watching our inept rival grind Cal into dust for 3 hours may have negatively colored my perception.
PFF Grades
And apparently my negative perception was indeed misguided because the countless eyeballs at PFF gave this game some respectable ratings:
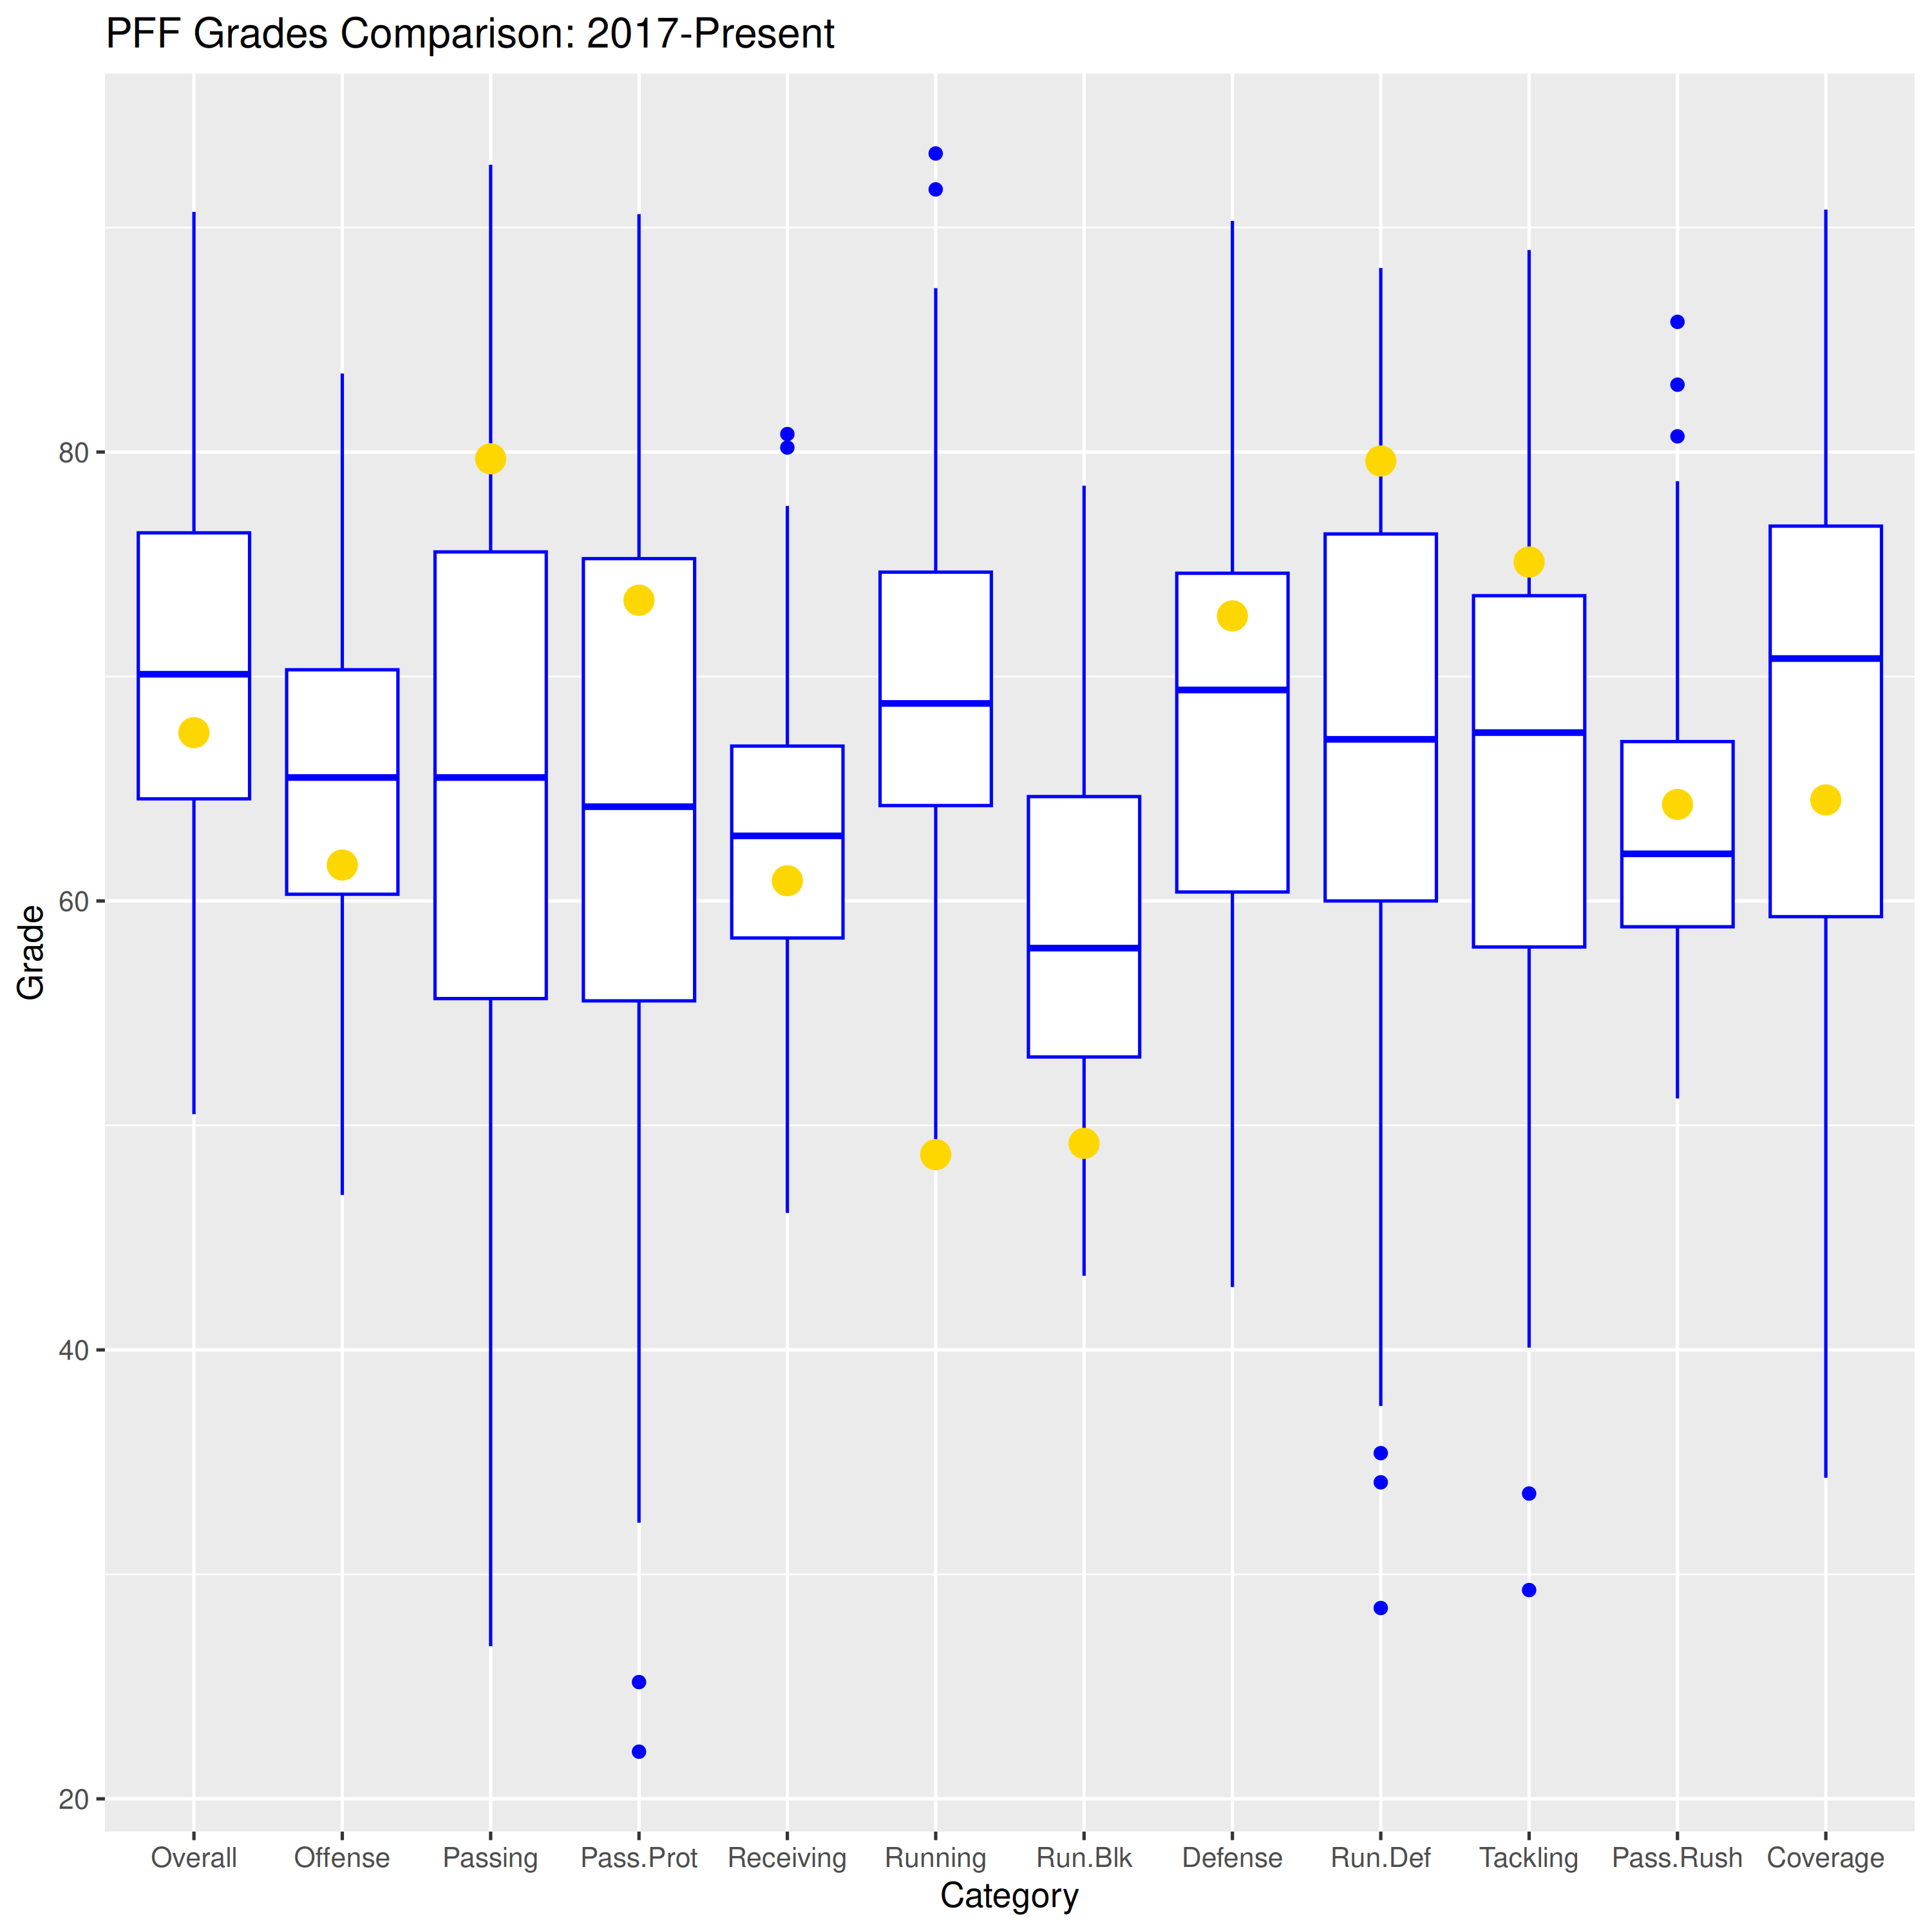
My lasting memories of the game were watching the offense slinging 5-yard passes because pass protection could not hold up any longer than that and watching the defense let yet another RB grind his way to triple-digit yardage. But apparently it was not that bad? Passing earned high marks while Pass Protection earned a strong grade. Everything else on offense struggled, as Receiving was mediocre, Run Blocking was terrible, and Running set a new low for the Wilcox Era. Defensively, grades were better as two categories finished above the 75th percentile: Run Defense (how?!) and Tackling. Pass Rush was slightly better than usual while Coverage earned a sub-par grade, although this did not hurt the Bears too much as LSJU only completed 10 passes.
So we have middling offense and strong defense—sounds like a recipe for a Rockfight.
PFF Clusters
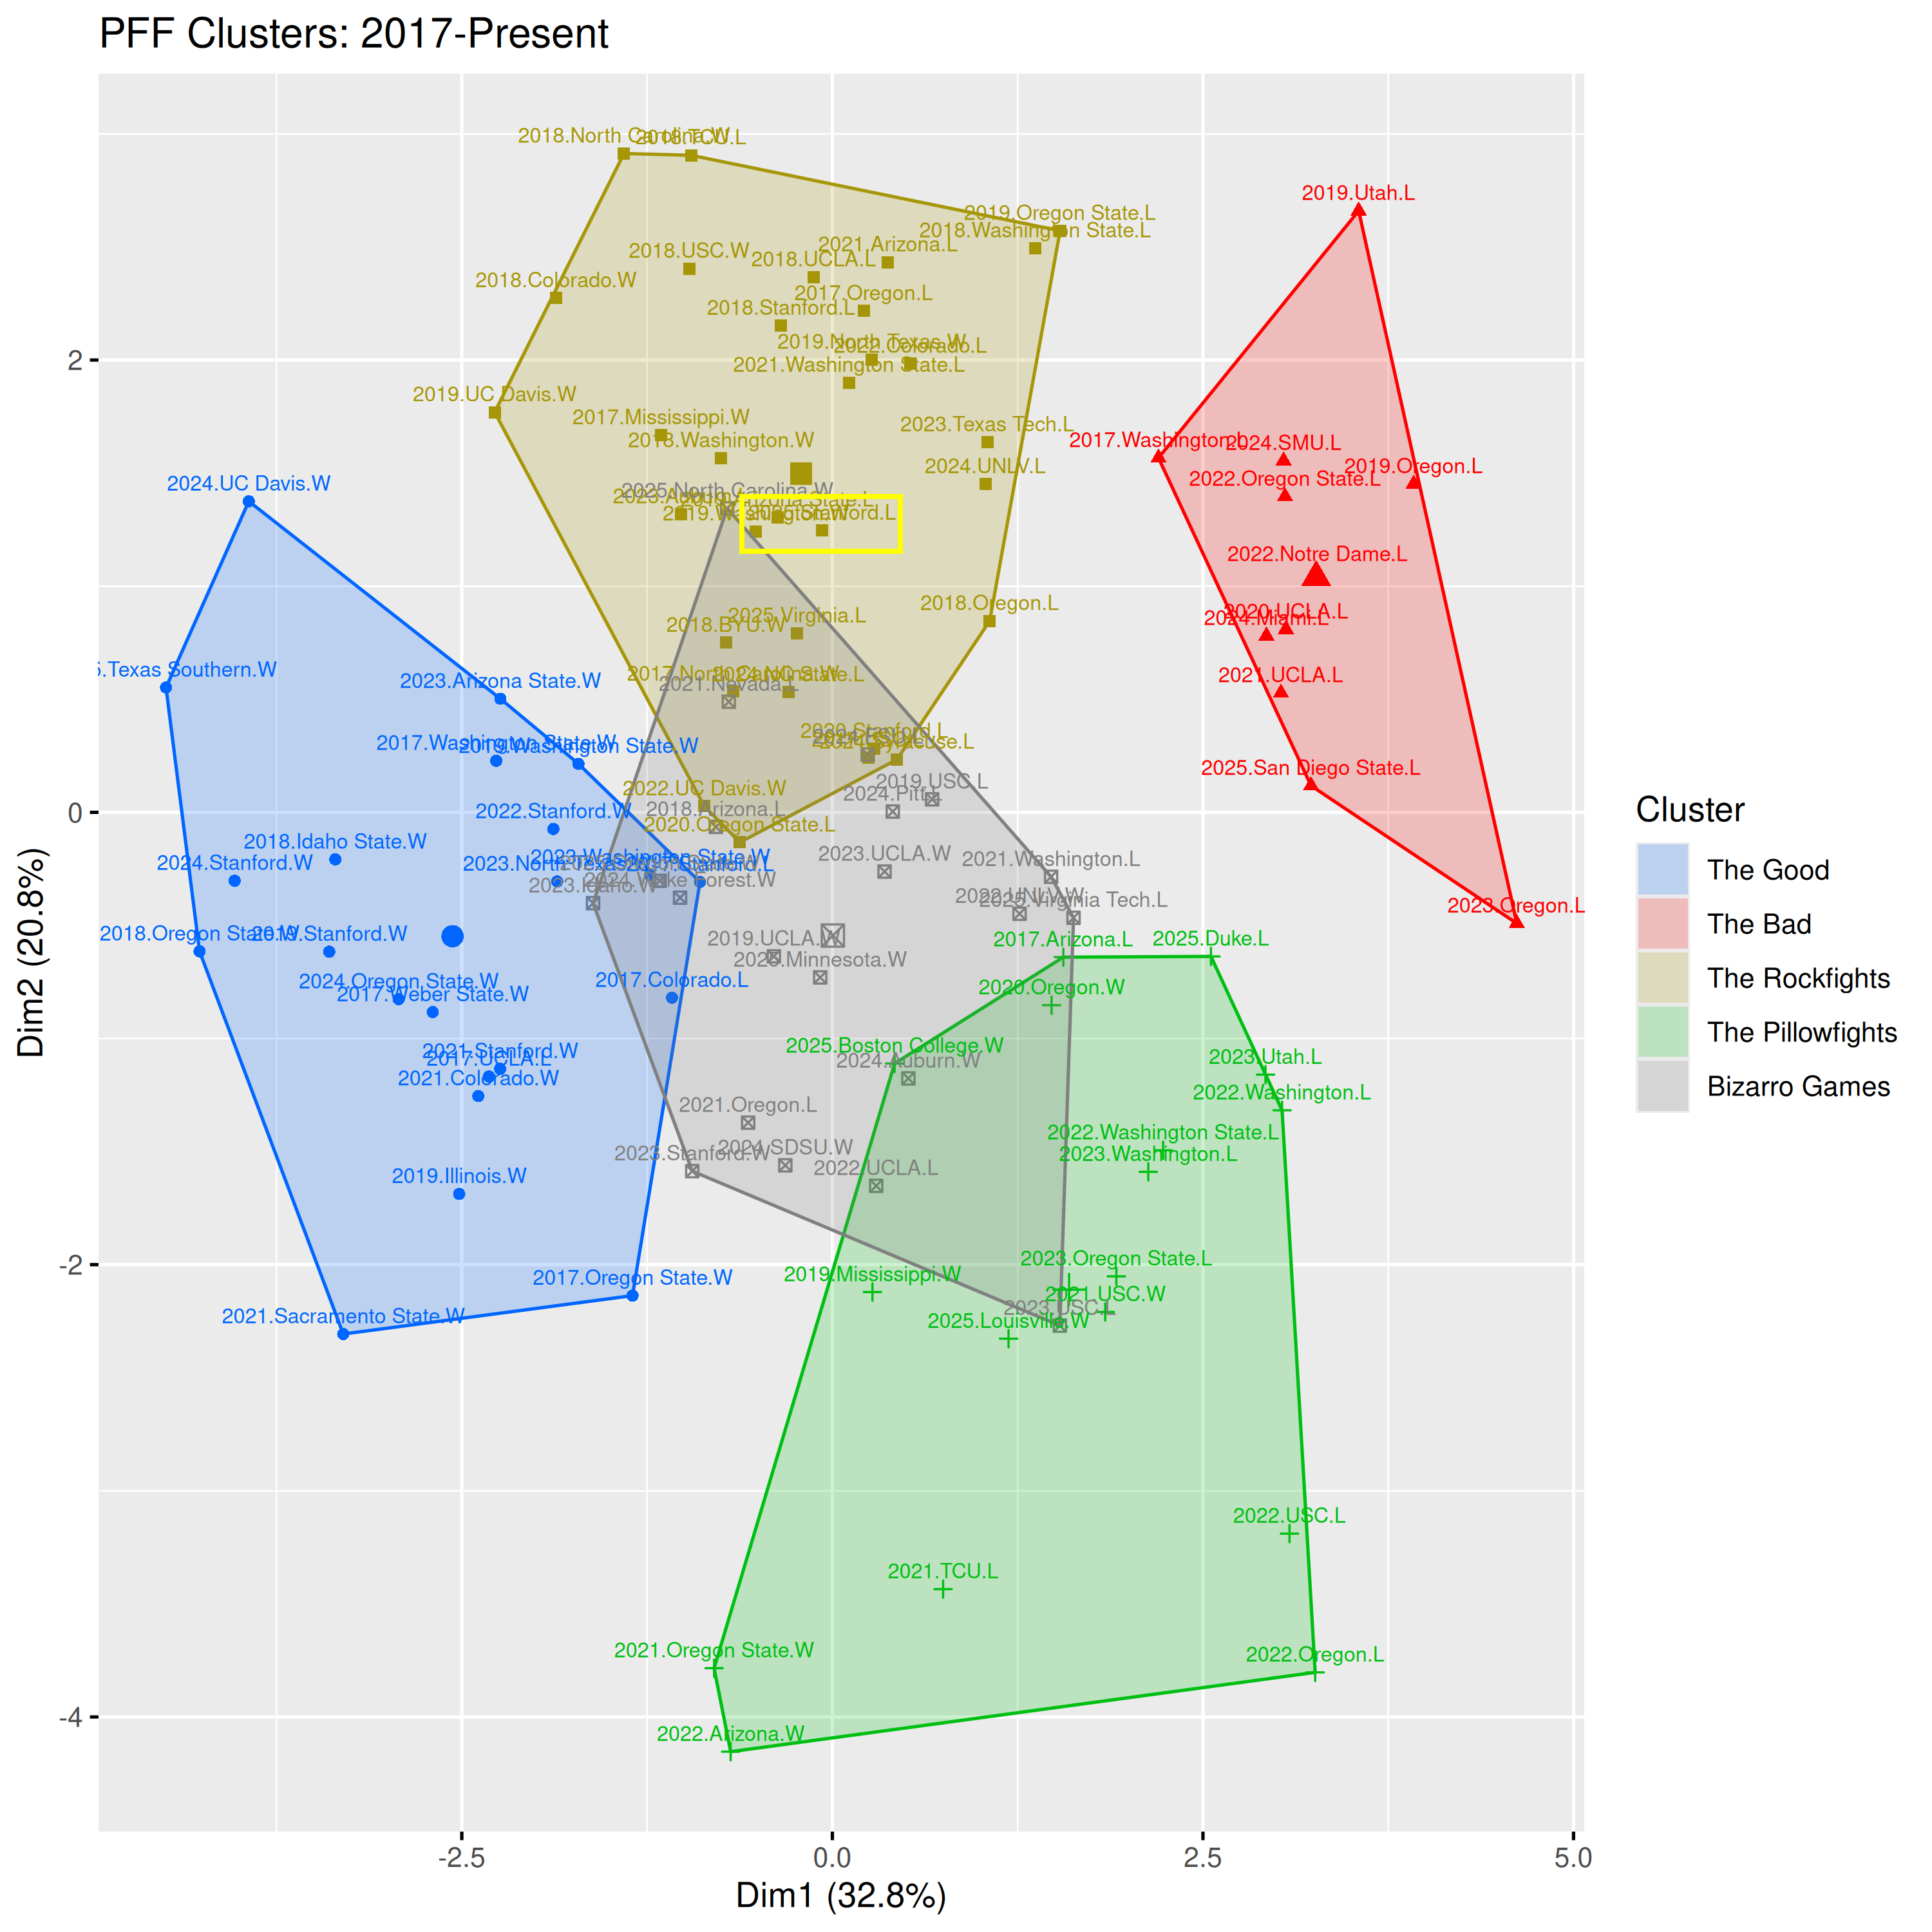
I fed the data into our clustering algorthim and…
Rockfight! There have been some territorial squabbles among our clusters lately, as The Bad added five new games last week and then relinquished those games back to Rockfights and Pillowfights this week. Meanwhile the Bizarro Games have regained control of the North Carolina win, which has occasionally been moonlighting as a Rockfight. That is a rather ignominious development, as this Saturday’s loss continues the Wilcox Era’s stupefying losing streak in Rockfights. As I have noted regularly in this series, Cal has not won a Rockfight since 2022 (UC Davis) and has not beaten an FBS team in a Rockfight since the 2019 Lightning Bowl win over UW. That 12-game FBS losing streak in Rockfights is a major contributor to Justin Wilcox’s newfound unemployment; once a hallmark of his teams, these defensive slugfests have had particularly painful outcomes in recent years. Saturday was the final and arguably most painful loss in this streak.
And now, our smattering of other PFF notables from Saturday’s game.
Odds and Ends
Offensive Player of the Game: QB Jaron-Keawe Sagapolutele, 73.7
Defensive Player of the Game: DT Michael-Anthony Okwura, 75.1; honorable mention to DT Aidan Keanaaina who earned a grade of 74.9 over 44 snaps in comparison to Okwura’s 6 total snaps.
Iron Men [played every snap]: QB Jaron-Keawe Sagapolutele, LT Nick Morrow, C Bastian Swinney, RG Tyson Ruffins, RT Braden Miller, LB Luke Ferrelli, LB Cade Uluave, CB Zeke Masses, CB Brent Austin, S Dru Polidore Jr.
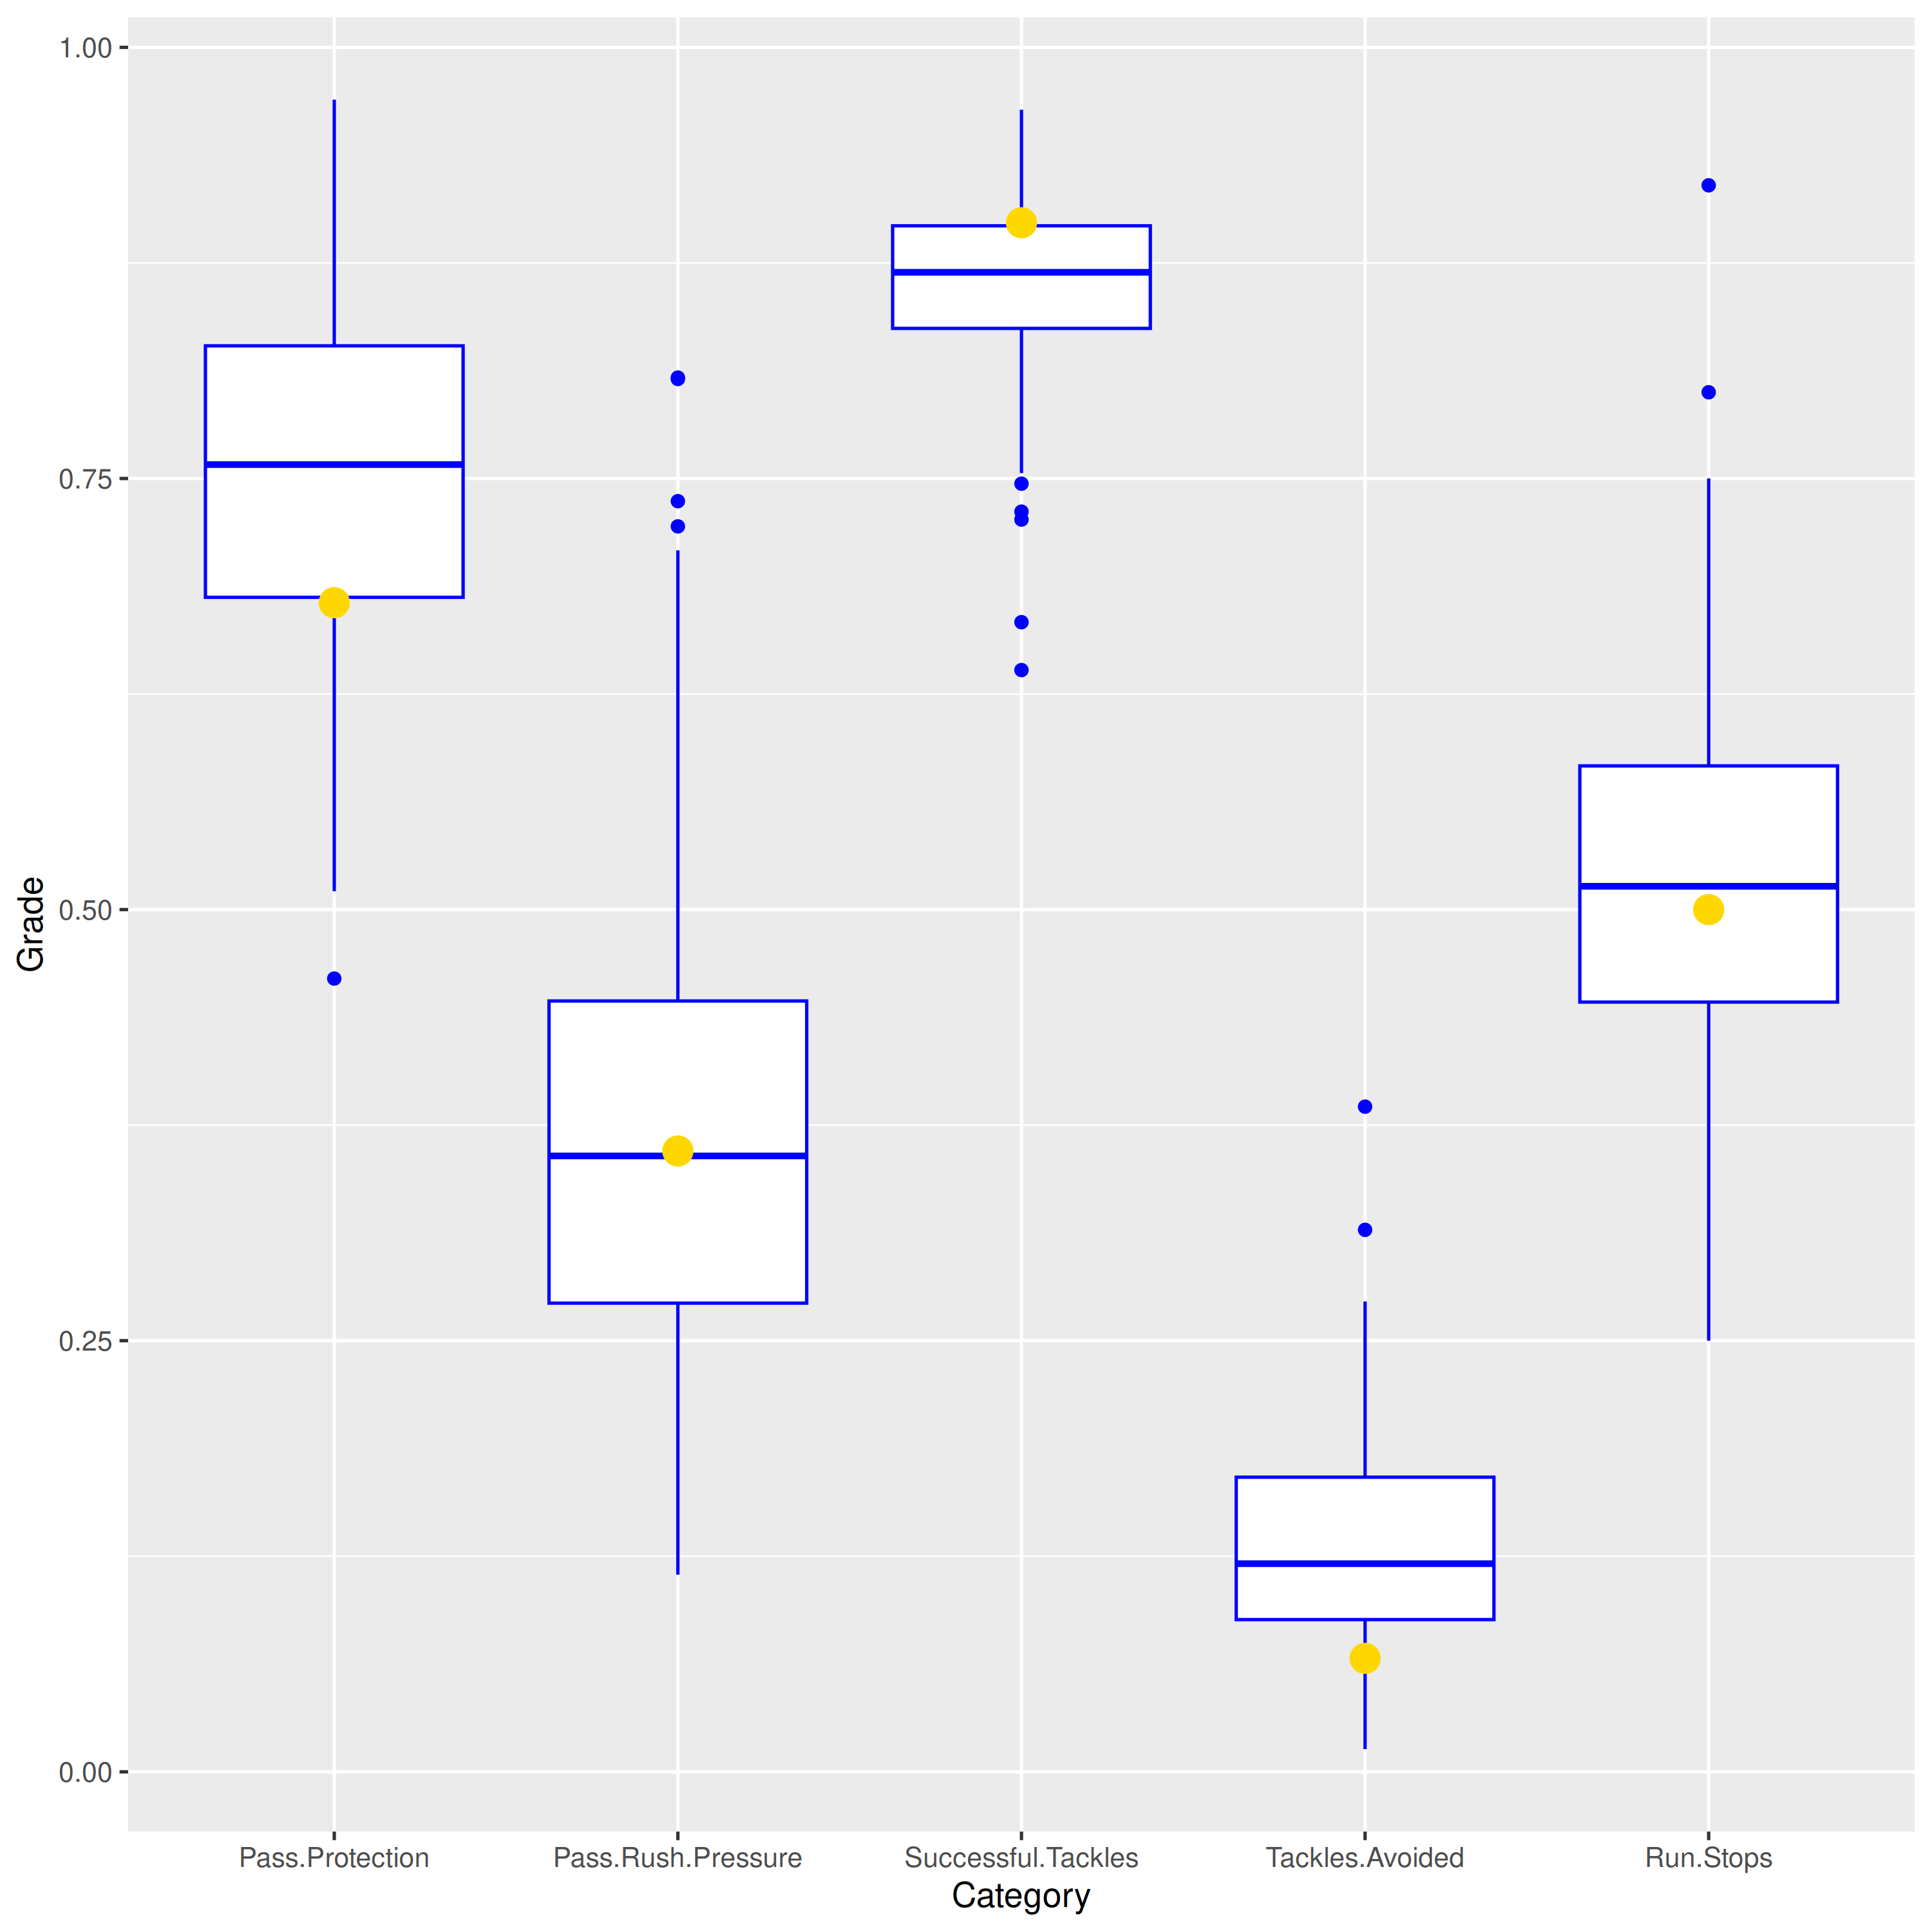
Pass protection: Cal allowed 19 pressures (1 sack, 2 hits, 16 hurries) on 59 pass plays, for an underwhelming protection rate of 67.8%
Pass rush: Cal generated 9 pressures (2 sacks, 2 hits, 5 hurries) on 25 pass plays for a middling rate of 36.0%
Tackling: Cal missed 6 tackles on 59 snaps for a better-than-usual tackling rate of 89.8%
Shake and Bake: Cal evaded only 5 tackles on 76 snaps for a woeful rate of 6.6%
Run stops: Cal stopped 17 of LSJU’s 34 runs, for a middling rate of 50.0%
The outcome on the field may be worse this weekend, but surely even the worst possible loss to SMU can’t be worse than this was, right? …Right?
Epilogue: Looking Ahead to the Future
While the entire point of this series has been to take Wilcox-Era performances and lump then into clusters of common types of games, we are entering a post-Wilcox Era. Obviously we still need to compare the SMU game and bowl game to something. But what? With Wilcox’s departure, so too I will let our the Good-Bad-Rockfights-Pillowfights-BIZARRO categories depart. This weekend kicks off a new era of Cal football and we need to figure out what kind of team this is. To that end, I am going to include all historic PFF data (dating back to the 2014 season) to build the clusters that we use to categorize the team. As the post-Wilcox Bears forge a new identity over the next couple games and in the 2026 season (and beyond), we will see where each game fits in comparison to all Cal teams for which we have data.
What kind of clusters will emerge? I’m not sure. I was planning to have a whole offseason to figure out how best to pivot to the post-Wilcox PFF clustering exercise, but now I only have one week to get started (good thing it’s a holiday and I’ll have time off work!). I’m expecting we’ll have a Good category and a Bad category, but I’m not sure what will emerge in between. With 9 seasons of Wilcox and 3 seasons of Dykes in the data, the clusters will probably be more representative of our previous Good-Bad-Rockfights-Pillowfights-BIZARRO categorization that characterized Wilcox teams. But the Bear Raid data may change our clusters in some surprising ways. I will not know more until I dig into the data and start playing around with the categories (or, more accurately, let the clustering algorithm have all the fun while I judge its results and tinker the algorithm accordingly) [update: because I can’t help myself, I’ve already started playing with the data. It looks like we may have 6 categories: 2 good-ish ones, 1 bad one, and 3 in-betweens. Other than looking at wins and losses in each category, I have not investigated differences among the three larger groupings and their smaller sub-groups within each. So I don’t have any insight into whether the categories look like Rockfights, Pillowfights, Bizarro Games, or something else entirely]. Until next week’s new exercise in introspection and self-identification, have a fulfulling Thanksgiving weekend.
Including Sonnyball won't be favorable for defensive stats, but will be bizarre. Wilcox leaving, and Rolovich taking over, won't change that either.
Regardless of who's the coach, Cal is still Cal as far as facilities and campus and community challenges go, and a Cal depth chart is what it is (has been thru multiple coaches), a recipe for a collection of bizarre rockfights, with the outcome dependent on whose' pillowcase has the most and biggest rocks in it.
This analytical series has been one of the most informative series I've read anywhere about any team, and eagerly look forward to seeing what the numbers and a Berkelium powered interpretation say about whatever comes along after Wilcox. (I'd love to see this applied to several other teams of note for reference.)
Not sure if I asked this before, but where are turnovers and penalties captured?