


Welcome back to The Good, the Bad, and the Rockfights, our weekly exercise in reviewing Cal’s most recent performance and lamenting that it is yet another example of The Bad. But wait! We have broken our streak of five consecutive games classifying the Bears in The Bad! (sure, as more data poured in two of those were reclassified as Rockfights, but it is still technically correct that every game has initially been classified in The Bad).
Glossary
First, a quick programming update: to make this series as accessible to newcomers as it is to those who have been reading it for several seasons, I’m going to start including a quick glossary of terms before moving into the data and results. This will help tidy up the following sections while still making the results accessible to people who forget, for example, what BCF Toys’ Available Yards stat measures. If you have an office in Evans Hall, you can skip this glossary (and please put that time towards finding a less bleak place to exist).
Plots
Boxplots: a boxplot illustrates the spread of data points. The plots used in this series highlight the most recent game’s rating in gold while the remainder of the data points are represented in the boxplot. The box captures data between the 25th and 75th percentiles while the horizontal line represents the median, or midpoint of the data. tl;dr: above the box = great, above the line = good, below the line = bad, below the box = turrible.
Cluster diagram: this illustrates our Good, Bad, Rockfights, and Pillowfights clusters. Each data point represents a game, and points closer together received more similar ratings while points farther apart received more dissimilar ratings. We use a k-means clustering algorithm to organize the games into four distinct clusters, which are color-coded in the plot.
BCF Toys Ratings
(the same ratings are used for offense and defense, so I will only define them once)
Game Rating (GR): opponent-adjusted FEI offense rating, capturing the expected scoring advantage the offense had against the opposing defense (and vice versa, for the defensive rating)
Efficiency (Eff): same as Game Rating, but the scoring advantage against an average defense
Points per Drive (PPD): points per drive during regulation, non-garbage time possessions (or opponent’s PPD, for the defensive rating)
Success Rate (SR): percentage of non-garbage time drives ending in a TD or FG attempt
Yards per Play (YPP): yards per play on non-garbage time possessions
Available Yards (AYd): the distance covered on a drive divided by the distance to the end zone when the drive began for non-garbage time possessions (basically, the proportion of the field covered during a possession)
Offense
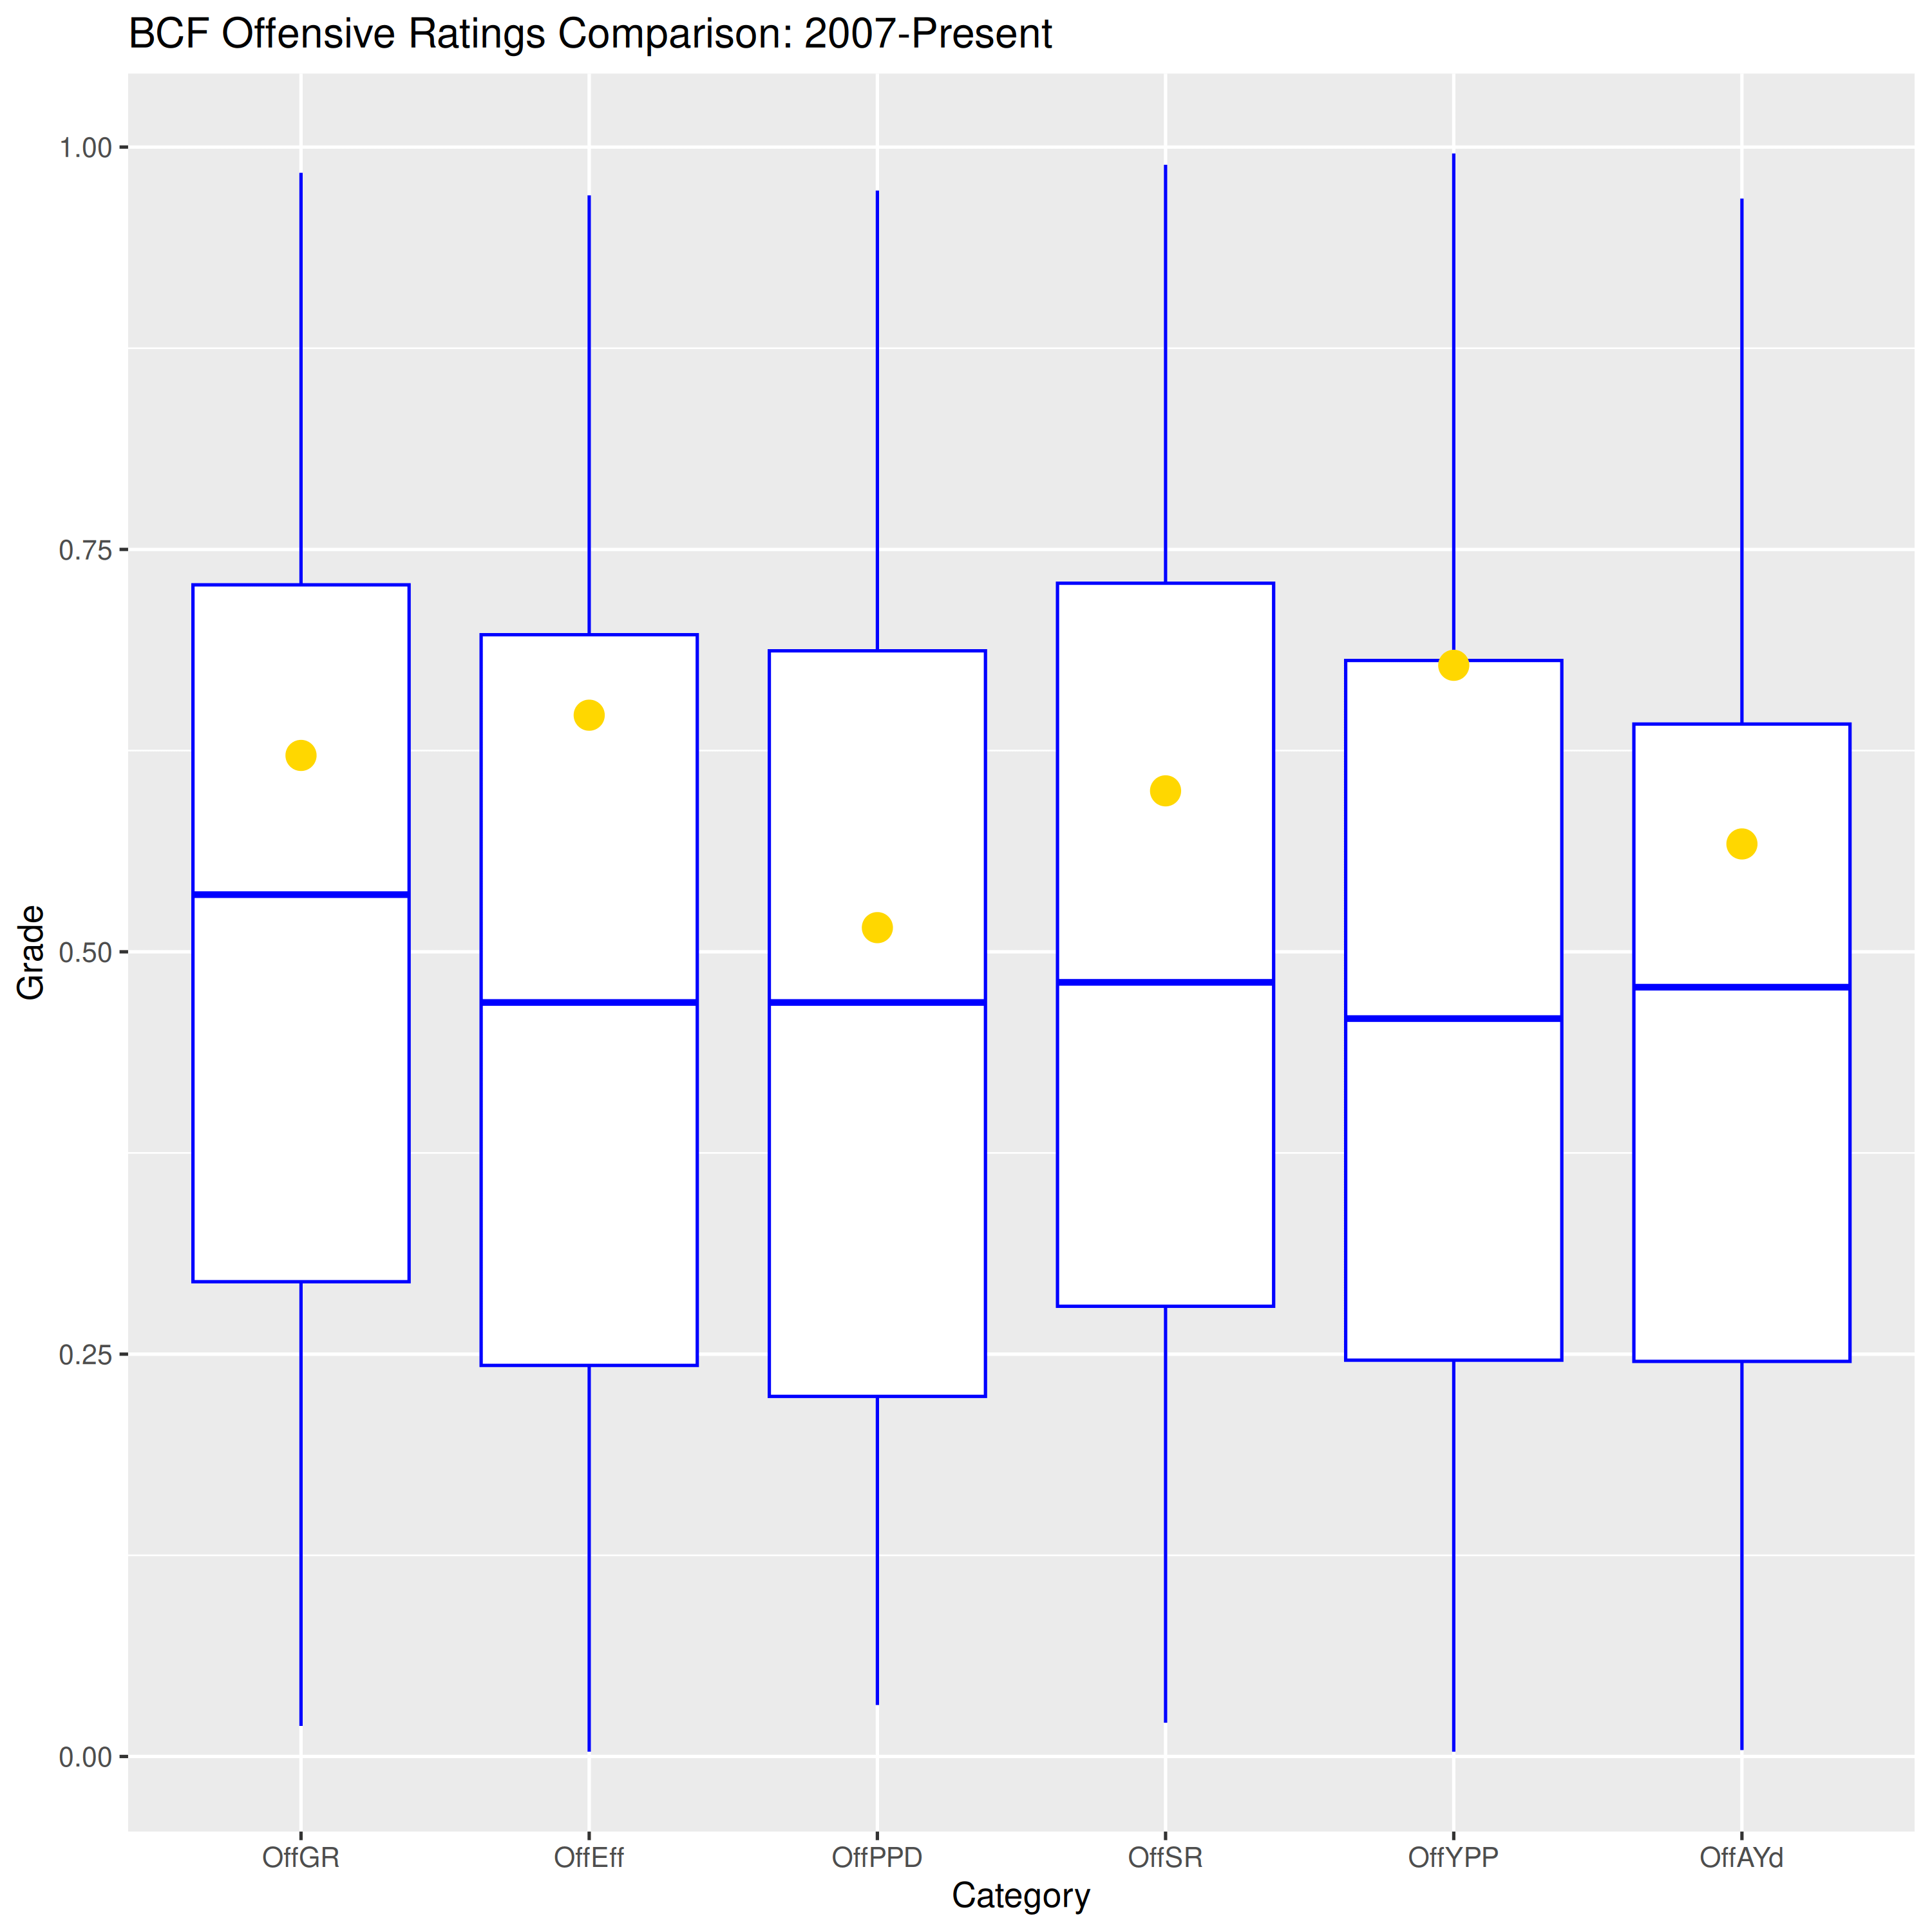
Everything is better than usual! Game Rating and Efficiency show that the offense was particularly effective overall. The Yards Per Play and Available Yards showed that Cal moved the ball efficienctly and comprehensively. However, the relatively middling Points per Drive reflects that Cal twice settled for field goals (and once could only muster 6 points on a TD drive).
Defense
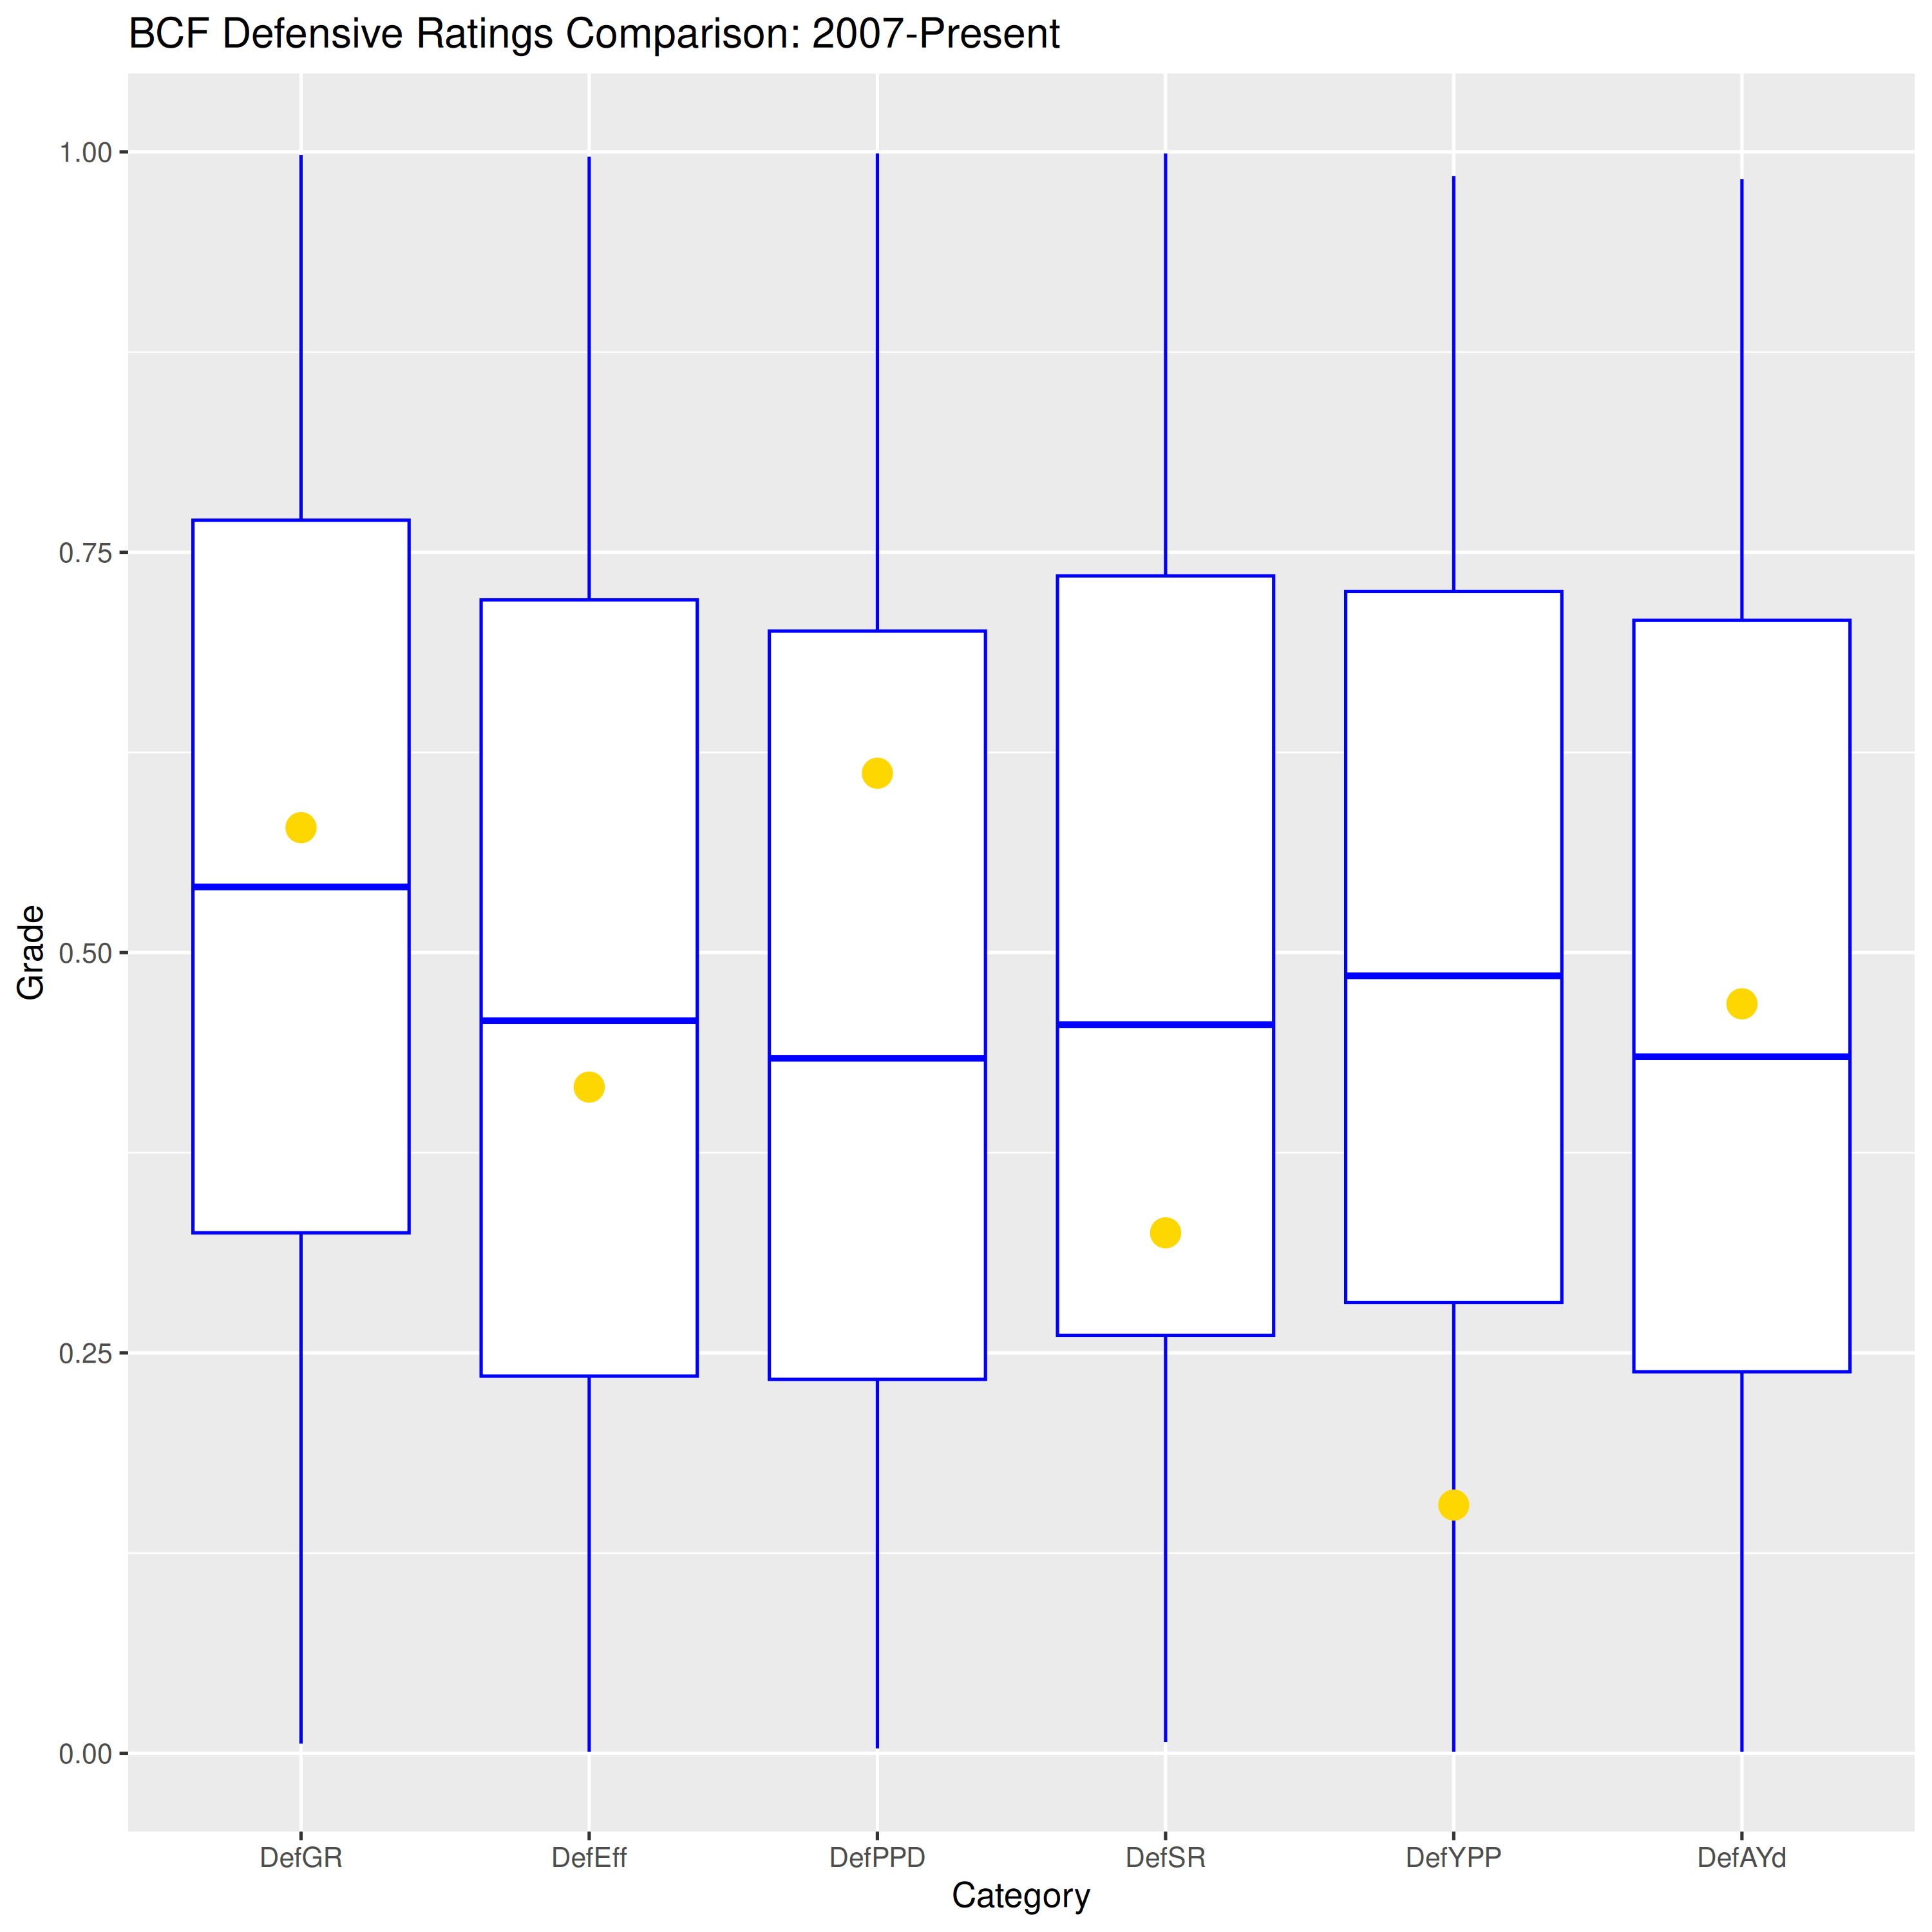
This looks like a bend-but-don’t-break profile. Game Rating and Efficiency were both middling, indicating that VT had moderate success offensively. Yards per Play reflects that the defense allowed VT to be reasonably efficient, while the defense’s mediocre Available Yards and poor Success Rate demonstrate that VT could cover the yards needed to get into scoring position. But VT struggled to translate those drives into points, as evidenced by the defense’s strong Points per Drive rating. Overall, Cal allowed VT to move the ball but the Hokies could not translate those drives into points.
Special Teams
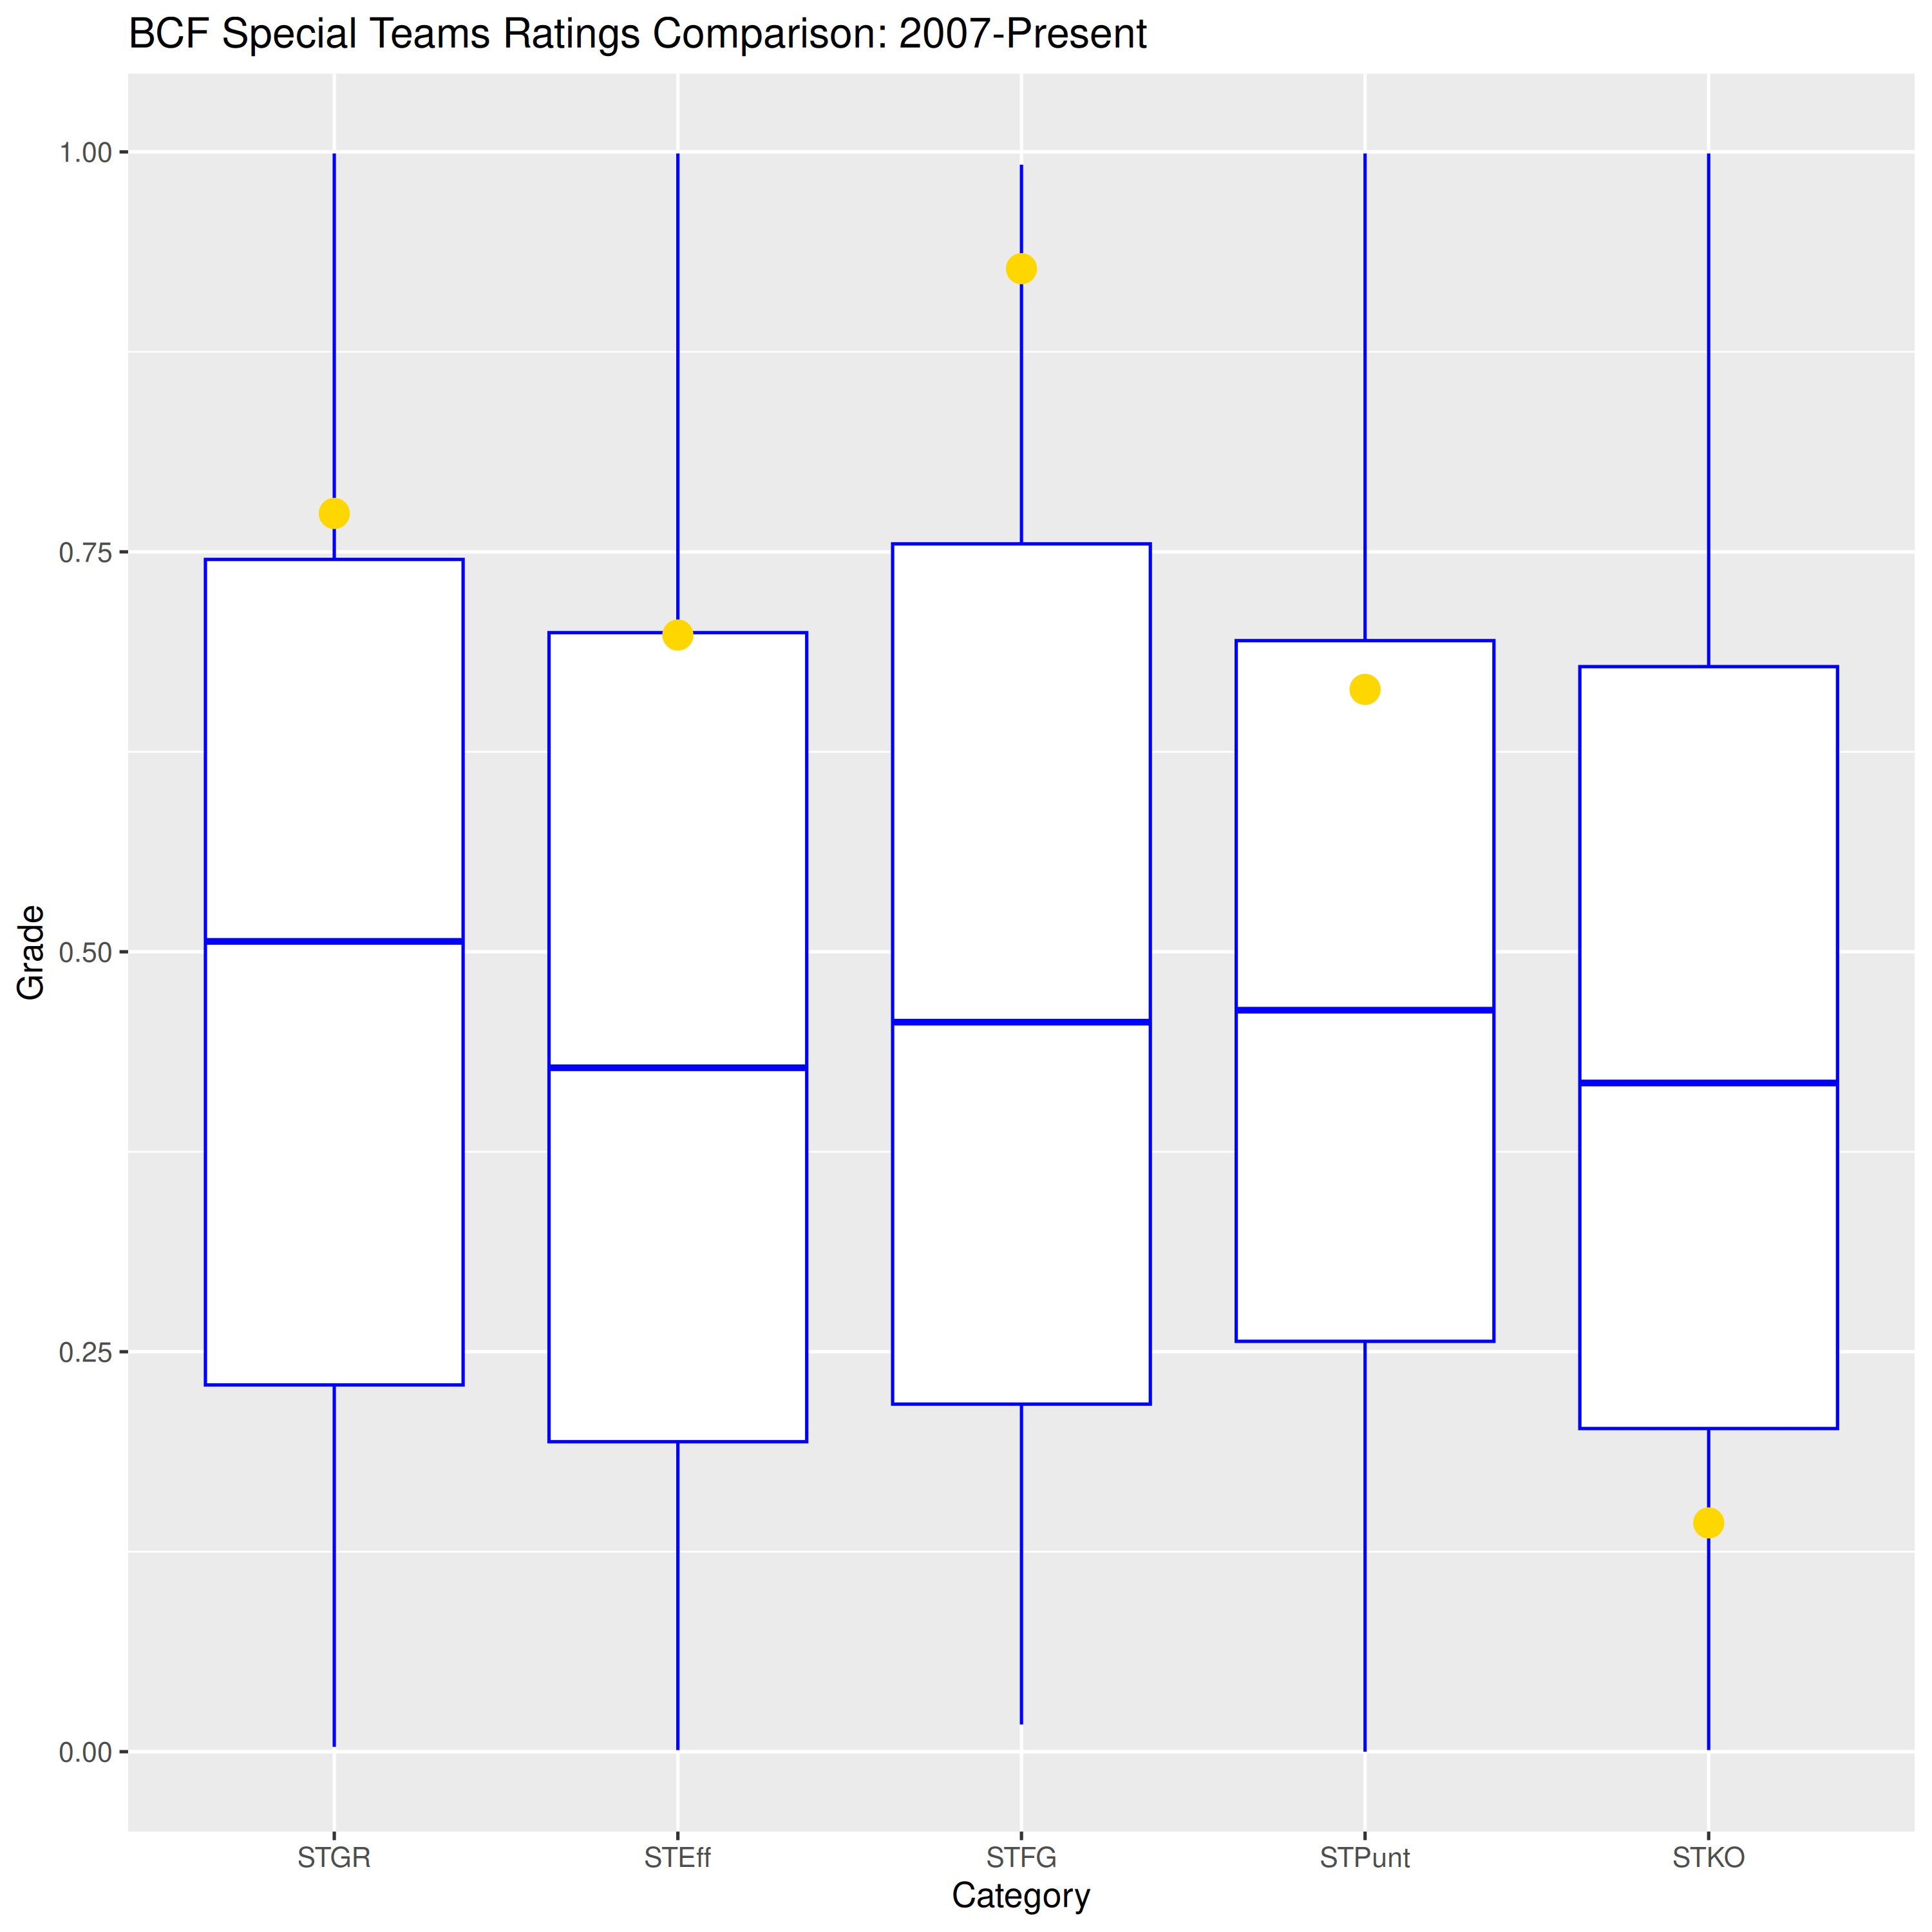
Cal punted and kicked field goals more effectively than VT, and those had a big effect on the game’s outcome. Kickoffs remain problematic, but not enough to dampen the overall special teams efficiency rating.
BCF Clusters
I fed the ratings into our clustering algorithm and it returned a…
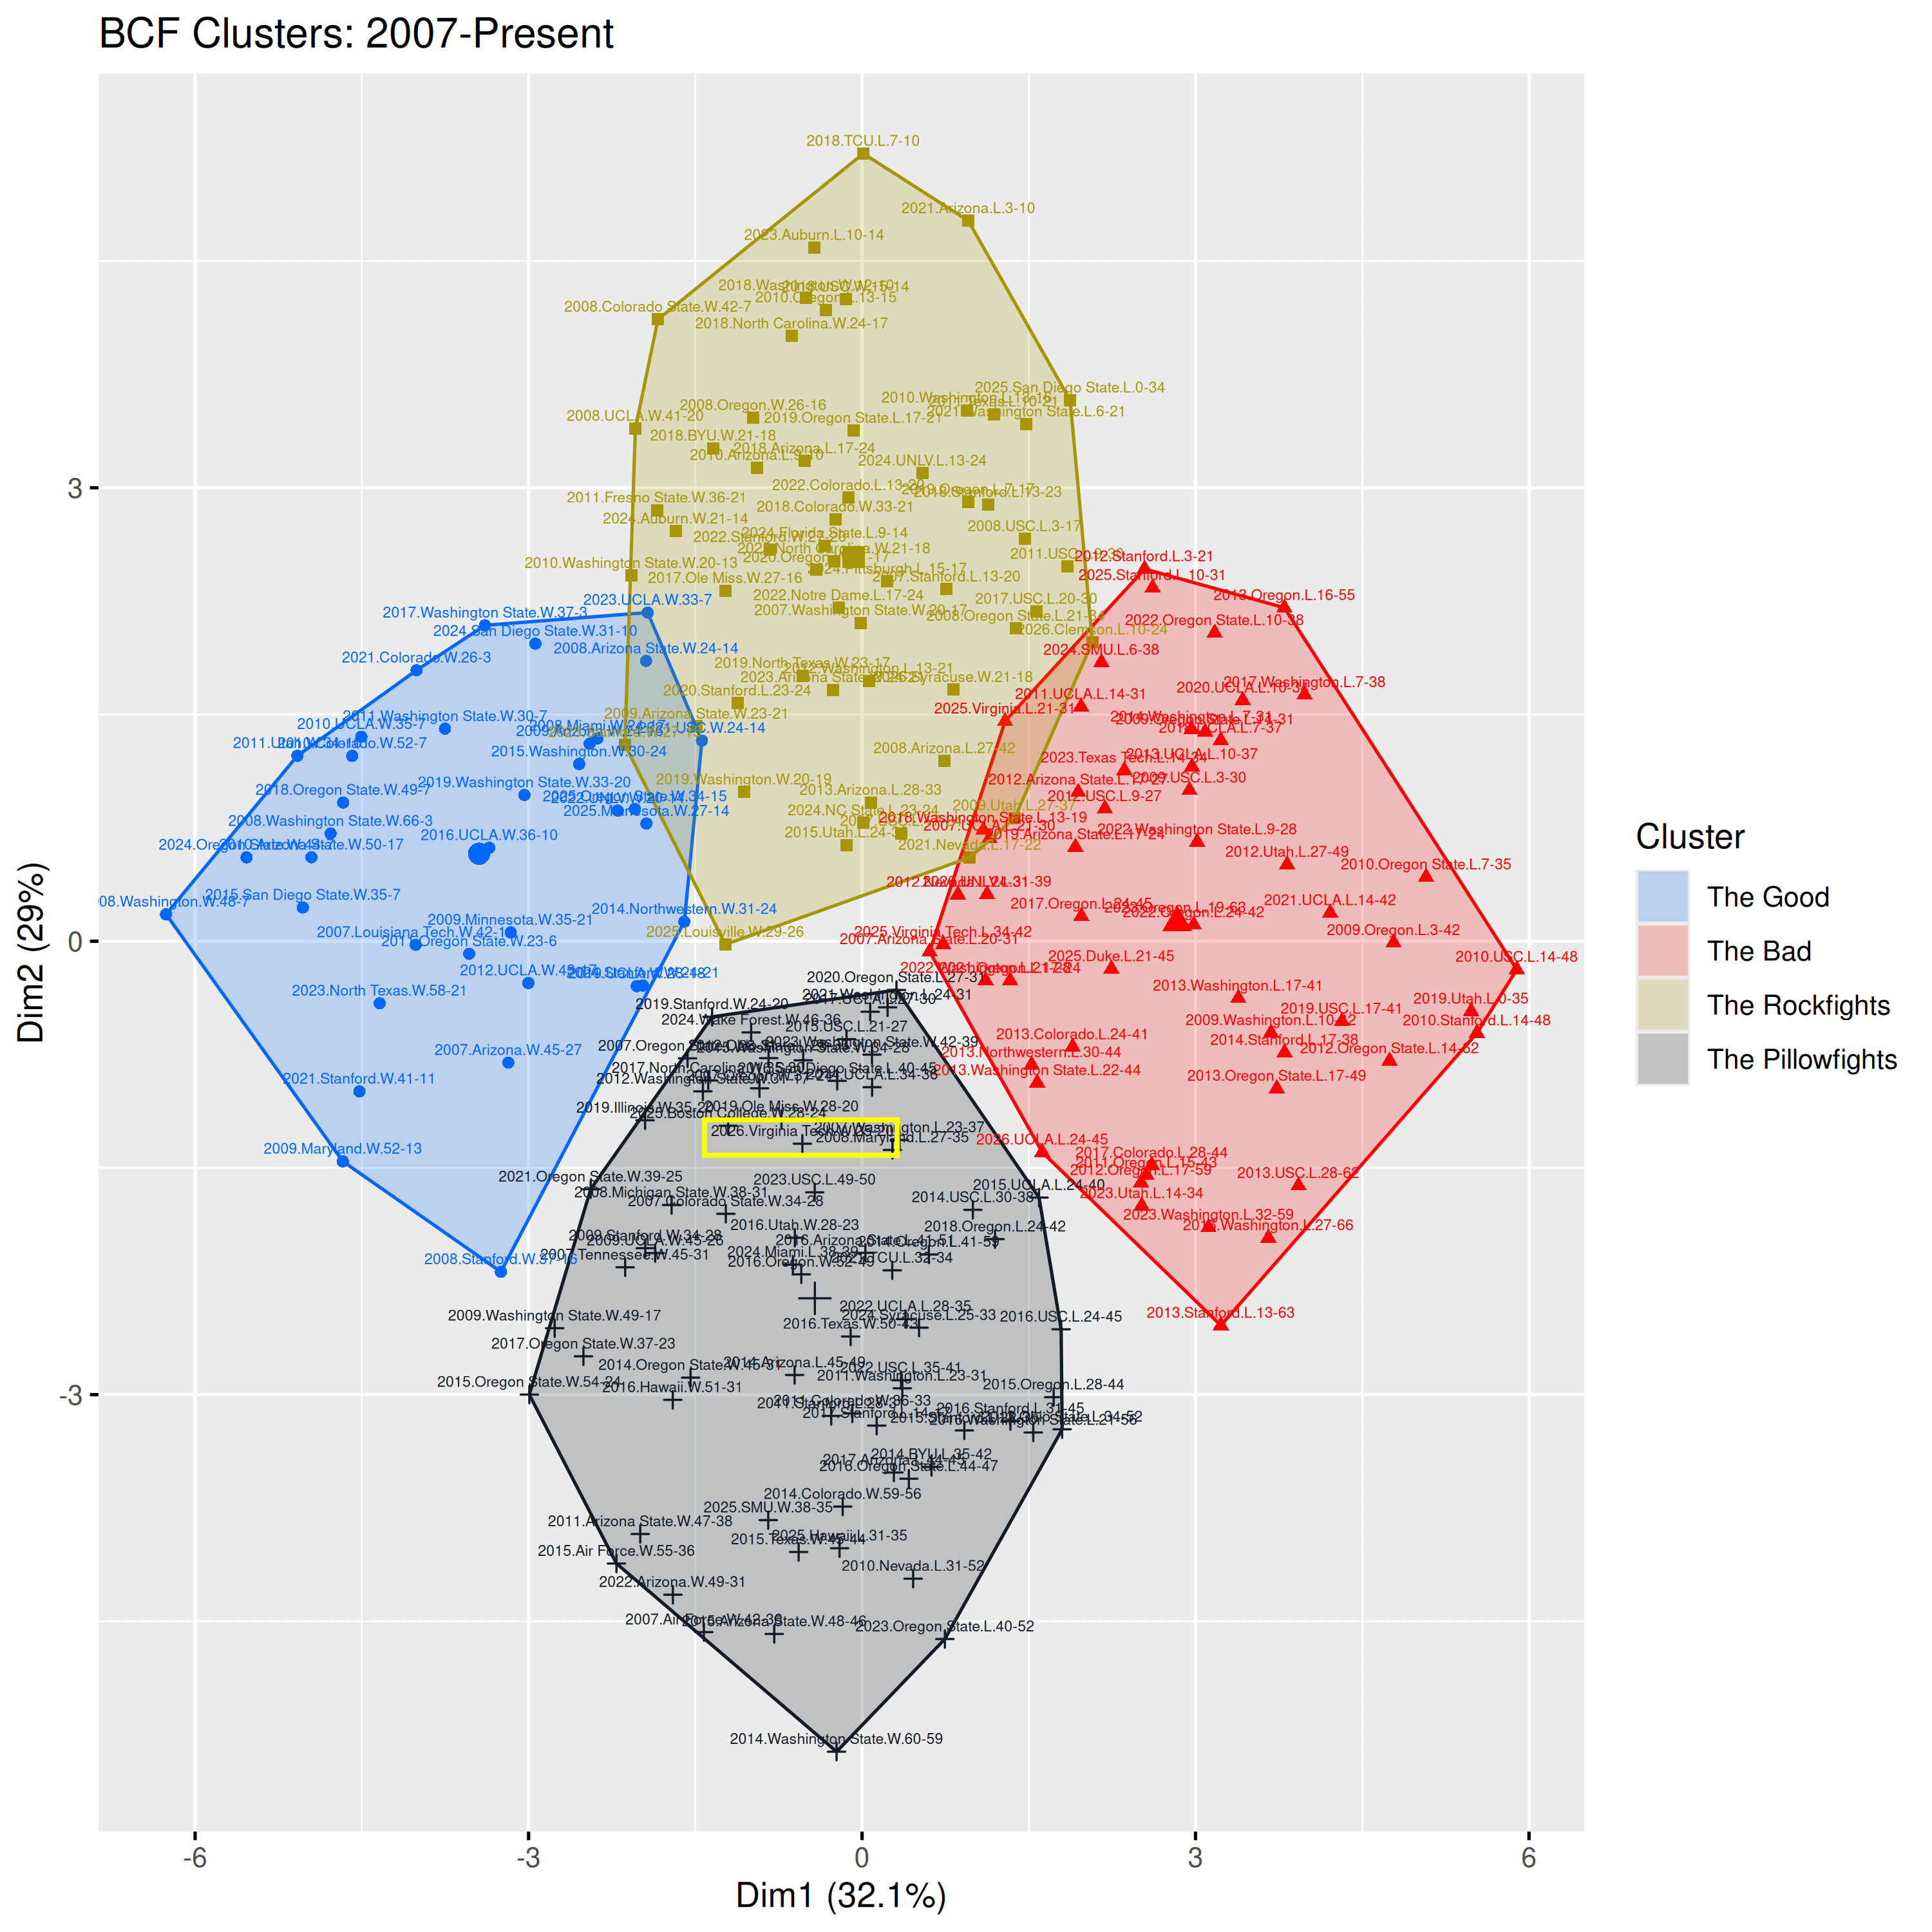
Pillowfight! The offense was strong enough and the defense surrendered enough yards that this one could not land among the Rockfights. Rather, it fell into the lower-scoring segment of Pillowfights. I’m just glad we finally landed somewhere besides The Bad.
Deja Vu
In our database of previous Cal games, the closest match to this one was the 2012 win over Washington State (31-17). Qualitatively, that one felt quite different from this week’s game, as Cal held a double-digit lead for most of the game and kept Wazzu out of the end zone until late in the third quarter. But this series isn’t about comparing vibes, it’s about comparing drives. And there the similarities begin to emerge. In both games the Cal offense was rather one-dimensional: last week the Cal ground game was mostly ineffective and in 2012 the passing game consisted solely of spamming the ball to Keenan Allen (fun fact, non-KA receivers caught 3 passes for 23 yards while Wazzu also caught 2). Instead, Cal relied on a steady diet of intermediate passes last weekend (totaling 321 yards) and a steamrolling ground game in 2012 (totaling 318 yards). Those offenses were productive enough to allow Cal to convert half their third downs and avoid too many three-and-outs (3 on 11 possessions last week and 4 on 13 possessions against Wazzu). In both cases Cal did a reasonable job at sustaining drives and turning scoring opportunities into touchdowns.
On the other side of the ball, the Cal defenses allowed many yards in both games (420 to Wazzu and 401 to VT) but they stifled many opposing drives before the end zone (Wazzu was 5/16 on third down while VT was 4/11). Critically, both opponents had to manufacture long, sustained drives to score. Wazzu’s three scoring drives were a 16-play, 86-yard drive ending in a FG; a 10-play, 75-yard TD drive; and a 9-play, 75-yard TD drive. Meanwhile VT scored TDs on a 7-play, 80-yard drive; a 7-play, 75-yard drive; and a 9-play, 73-yard drive. Preventing explosive plays was critical for both Cal defenses to keep the opponent relatively contained.
In your glossary, a qualitative description of what Good, Bad, Pillowfight and Rockfight actually mean would be helpful. Otherwise the whole quantitative analysis becomes less meaningful.