


[Update: An Unfortunate Programming Note]
I had written this entire, nearly 2000-word piece when the W4C staff received some unfortunate news. We had previously worked with PFF to acquire the data I used for this weekly series. It cost money, but PFF’s subscription prices were modest (in the low hundreds, if I remember correctly). Then PFF was sold this spring. PFF laid off half its staff (and many found out through social media rather than directly from company sources—classy) and, as is all-too-common in the wake of private equity investment, PFF is charging much more money for a product that will likely be much worse [I’m doing my best to avoid channeling my inner christopher_h and going fully scorched earth on private equity firms, and this is a herculean exercise in restraint to avoid devoting another 2000 words on those bloodsucking parasites]. How much more? A minimum of $10k per year for W4C to access their data. That’s absurd. I have enjoyed the scope of PFF’s data and although I have had some quibbles with its reliability, a one-hundred-fold increase in price is insanity. We will obviously be moving to a new data source this season. That requires some heavy lifting initially while I gather all the data and tune the clustering algorithms, so this series may have to go on a brief hiatus. But I will work as hard as I can to reboot the series with a new data source in time for the post-UCLA analysis. Until then, here’s what would have been our re-introduction to the series [with some notes here and there about what will and will not apply to our new data source]…
Intro to The Good, the Bad, and the Rockfights
Welcome back to the Good, the Bad, and the Rockfights, our weekly attempt to fit 11 players’ performances over 70-something snaps into a tidy box. This exercise uses data from Pro Football Focus, whose virtual panopticon evaluates every single player on every snap. These individual grades are distilled into several team level grades: Overall, Offense, Passing, Pass Protection, Receiving, Running, Run Blocking, Defense, Run Defense, Tackling, Pass Rush, and Coverage. And we use those grades to fit the team’s performance into one of six categories of Cal football games (you can read more about the clustering algorithm here, but be warned: thar be maths! [I will use the same clustering approach with our new data set, so although the clusters may be different, the analytic approach will be fundamentally the same]).
The Six Types of Cal Football Games
We can visualize the data to highlight the six clusters [what will the clusters look like with a new data source? I have no idea]. In this visualization each data point represents a game, and games closer together received more similar grades while games farther apart received more dissimilar grades. Games naturally cluster together into six (mostly) distinct categories: The Good, The Bad, Wilcoxian Rockfights, Wilcoxian House of Cards, Sonny Delight, and Sonny Yikes (as these names suggest, these represent the best of times and the worst of times under the previous coaching staffs [we’ll almost certainly have a new set of categories under our new data, but I’m hoping I can recycle some of these names because I genuinely enjoyed several of them]).
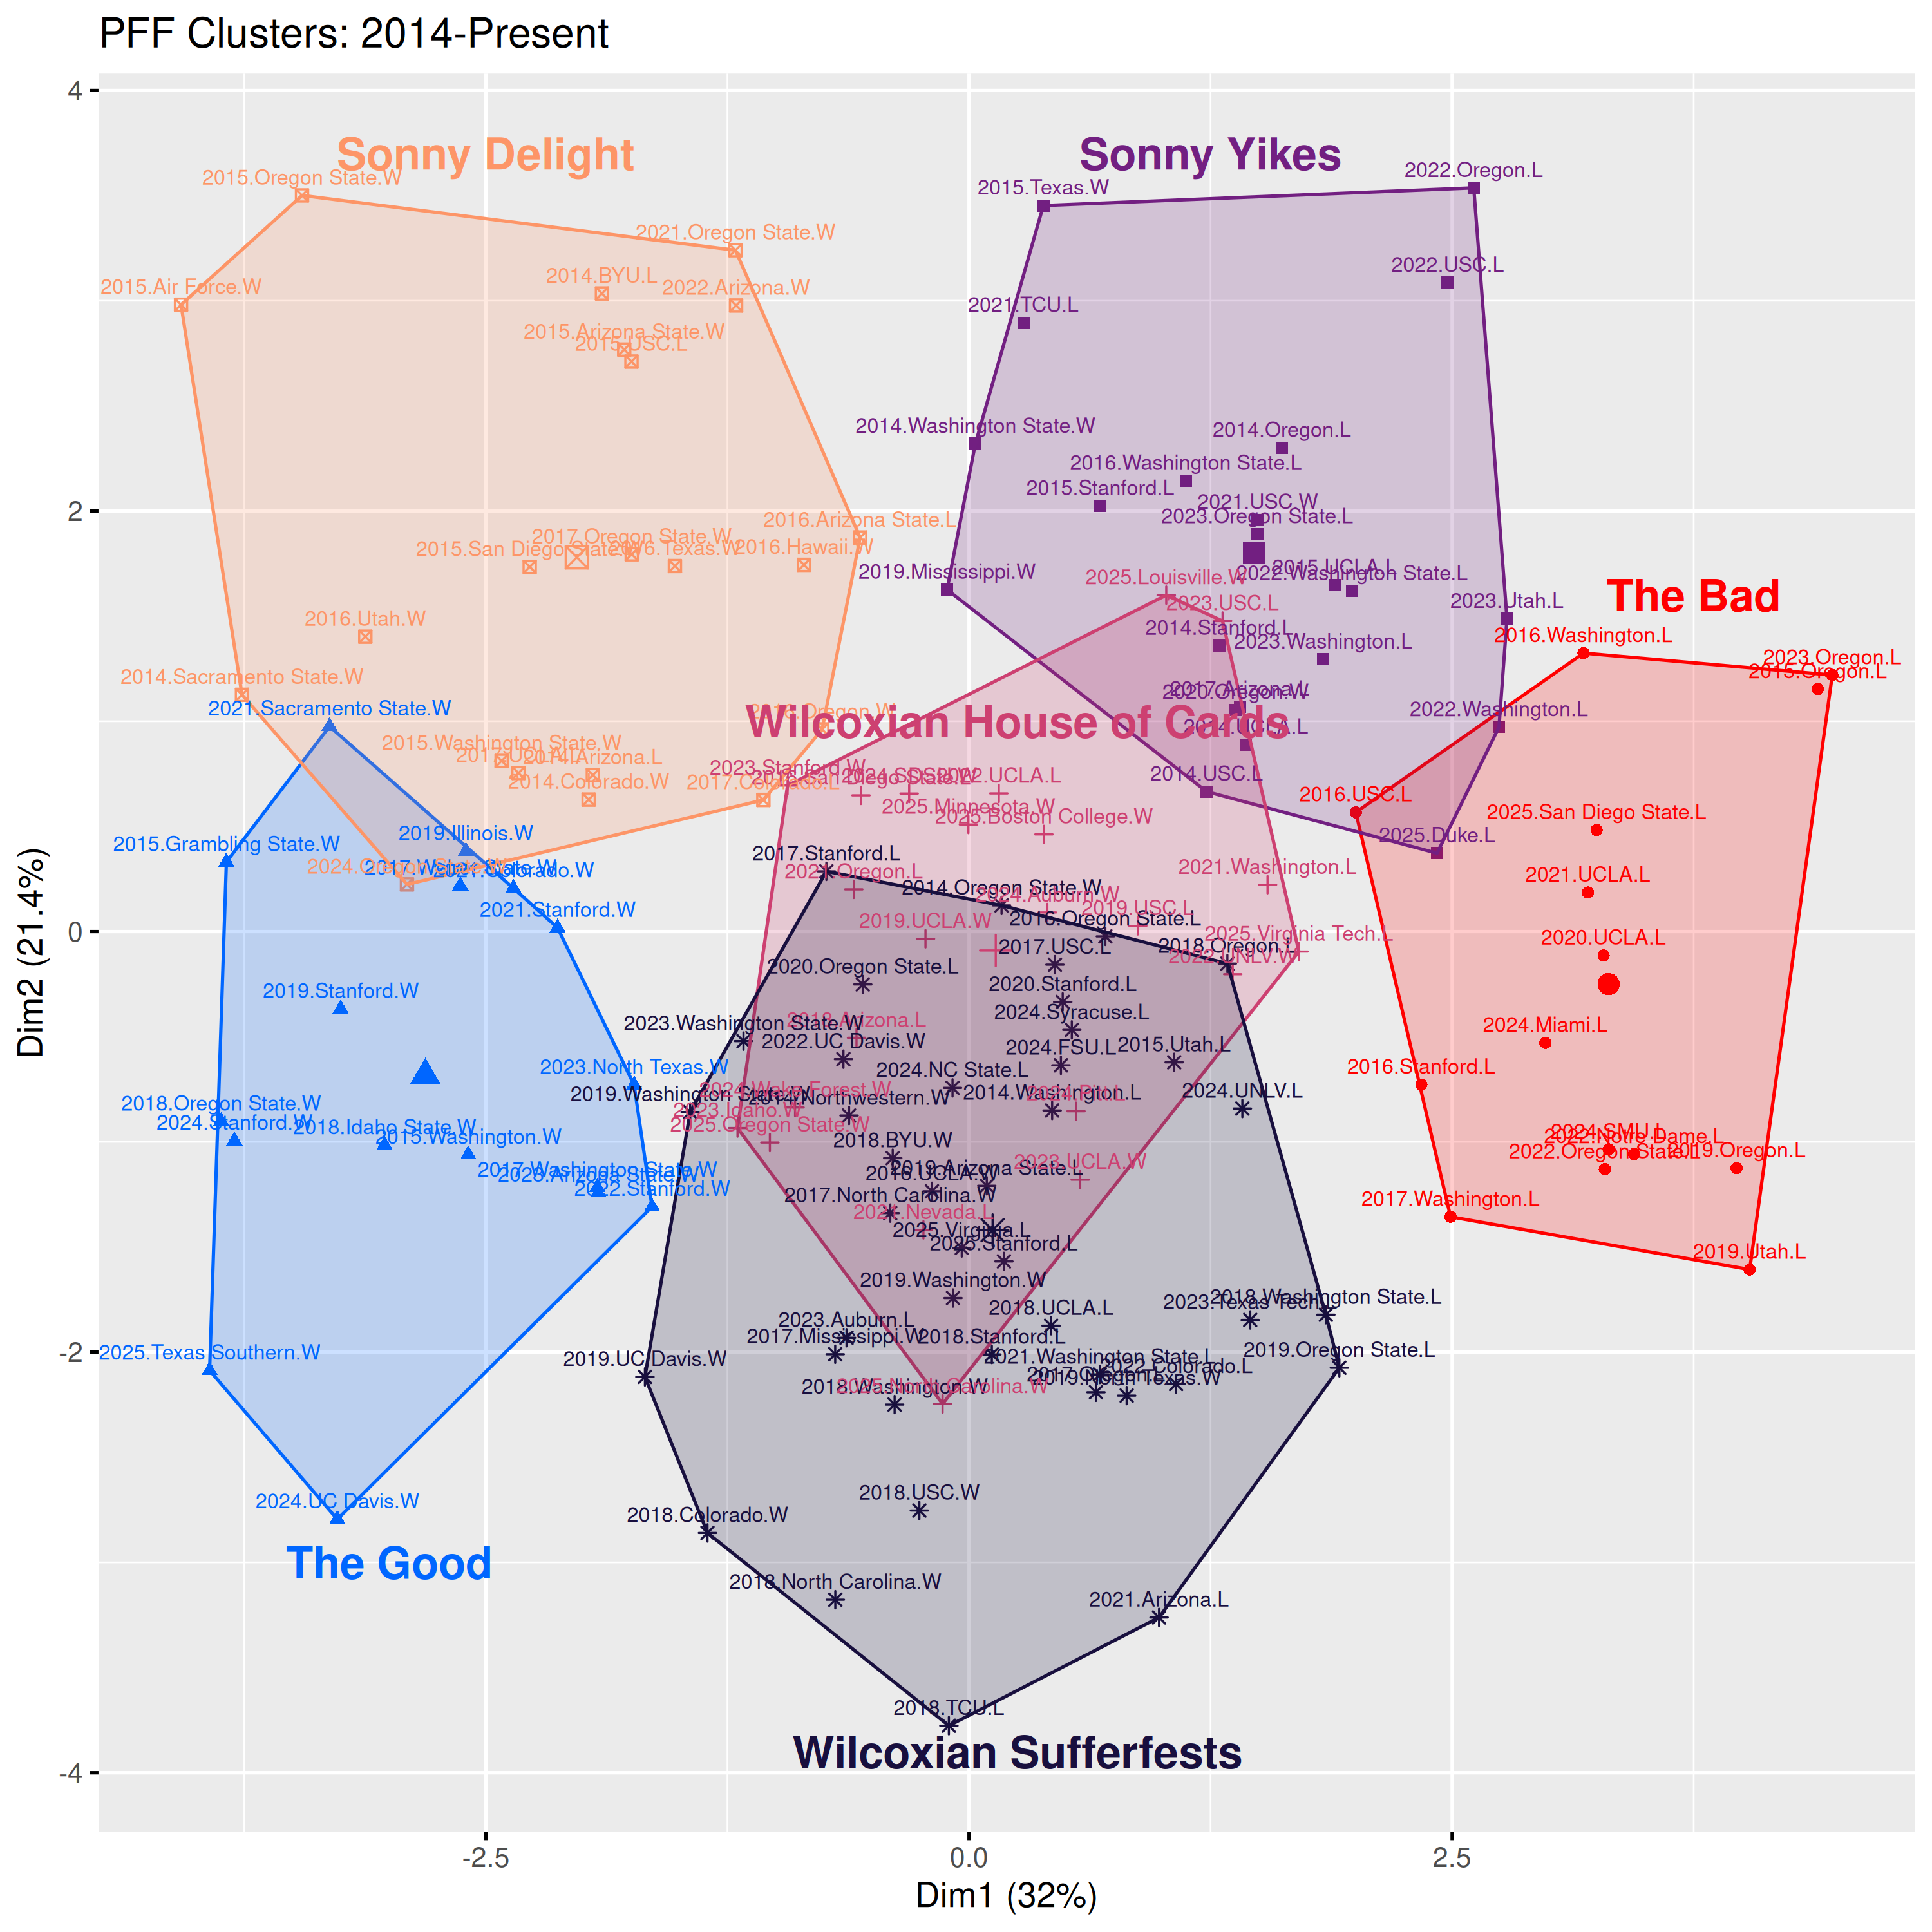
We distill the performances down to a two-dimensional representation because capturing all eleven grading categories would require an 11-dimensional projection and that’s a bit cumbersome to display with modern technology.
Each of the six clusters represents a different “flavor” of Cal football, and going through an exemplary game from each category helps to highlight the quirks of each category [at this point, we’re just going over these categories for posterity because we’ll have a new set of categories with our new data source].
The Good: as the name suggests, the Bears earn solid grades in all defensive and offensive categories. The 2018 win over Idaho State exemplified a solid performance on both sides of the ball as Cal cruised to a 45-9 lead before surrendering a couple garbage time touchdowns.
Most typical game: 2018, Cal 45, Idaho State 23 (PFF grades: Overall: 87.8, Offense: 73.5, Passing: 83.9, Pass Blocking: 76.5, Receiving: 57.6, Running 76.7, Run Blocking 67.5, Defense: 78.9, Run Defense: 78.2, Tackling: 70.5, Pass Rush: 76.1, Coverage: 74.1)
The Bad: another obvious one—Cal struggles on both offense and defense in The Bad. If you have not repressed the memory, you may recall Cal’s season opener at UCLA in 2020 (at 9am on a Sunday, just to make things extra weird). Cal turned in one of the worst offensive performances of the Wilcox Era, with an excruciating average of 2.4 yards per play. Meanwhile the defense was steamrolled by the UCLA running game, which tallied 244 yards. Nothing about this game was pleasant.
Most typical game: 2020, Cal 10, UCLA 34 (PFF grades: Overall: 54.4, Offense: 55.6, Passing: 52.2, Pass Blocking: 60.0, Receiving: 49.6, Running: 68.8, Run Blocking: 64.4, Defense: 55.3, Run Defense: 56.0, Tackling: 51.3, Pass Rush: 61.2, Coverage: 52.3)
Sonny Delight [I’m particularly annoyed about this PFF fiasco because at the end of last season I went back and pulled all the grades from the 2014-2016 seasons, just for those grades to be included in 2 posts in this series]: This was a typical strong performance in the Sonny Dykes era: spectacular offense and just enough defense to seal the victory. The typical example, the 2016 Cal-Texas game, saw Texas take multiple leads, including multiple double-digit leads, before the Bears sealed the victory behind a flurry of touchdowns in the final sixteen minutes (including one would-be Cal touchdown that would have pushed the score to 57-43).
Most typical game: 2016, Cal 50, Texas 43 (PFF grades: Overall: 79.6, Offense: 78.9, Passing: 81.6, Pass Blocking: 76.3, Receiving: 78.8, Running: 62.1, Run Blocking: 64.6, Defense: 65.2, Run Defense: 54.3, Tackling: 49.7, Pass Rush: 59.4, Coverage: 79.5)
Sonny Yikes: This is a typical high-scoring loss we would often see under Sonny Dykes. The main difference between Sonny Delight and Sonny Yikes is that the latter has slightly worse defense and a more inconsistent offense, often one that goes through a scoring drought at some point during the game (which usually allows the opponent to build an insurmountable lead). Although the example below is from the Wilcox Era, it followed a common script for these types of games: Cal and OSU spent much of the game trading touchdowns until a fifteen minute scoring drought by Cal allowed the OSU offense to score 17 unanswered points, ballooning a 3-point lead to a 20-point lead.
Most typical game: 2023, Cal 40, Oregon State 52 (PFF grades: Overall: 64.1, Offense: 74.0, Passing: 70.0, Pass Blocking: 42.9, Receiving: 66.2, Running: 82.6, Run Blocking: 65.4, Defense: 47.9, Run Defense: 54.1, Tackling: 63.2, Pass Rush: 59.8, Coverage: 34.5)
Wilcoxian Rockfights: The stereotypical Justin Wilcox game, dominated by strong defenses and lifeless offenses. Often the Rule of 21 applies here, where the first team to hit 21 points usually wins. The example below comes from the 2025 Virginia game, where some early and late scoring by both teams was sandwiched around 8 consecutive scoreless drives by both teams. These games are often decided by a critical turnover or two, such as the game-sealing pick six that ended Cal’s potential game-winning drive.
Most typical game: 2025, Cal 21, Virginia 31 (PFF grades: Overall: 73.8, Offense: 62.9, Passing: 67.5, Pass Blocking: 51.7, Receiving: 64.3, Running: 65.7, Run Blocking: 50.5, Defense: 72.4, Run Defense: 78.7, Tackling: 74.8, Pass Rush: 65.2, Coverage: 64.7)
Wilcoxian House of Cards: This is a newer class of game that emerged later in the Wilcox Era. These are games where skill players on offense turn in strong performances, but the offense is hamstrung by awful line play. Similarly, the defense is generally strong in every facet except tackling. Overall, these are good performances held back by a frustrating lack of execution in the fundamentals. The example below, the 2024 win over Auburn, had mostly strong grades except for a poor tackling grade and a spectacularly bad pair of grades for the O-line. Self-inflicted wounds are critical in these games: Cal had 11 penalties and allowed 8 tackles for loss, consistently setting the offense back (which is part of the reason Cal punted on 5 consecutive possessions). The defense struggled tackling, with 11 missed tackles on 62 plays. Fortunately Auburn was eager to give the ball away, as they had a whopping 5 turnovers.
Most typical game: 2024, Cal 21, Auburn 14 (PFF grades: Overall: 67.9, Offense: 65.7, Passing: 82.1, Pass Blocking: 25.1, Receiving: 70.1, Running: 70.6, Run Blocking: 47.5, Defense: 66.9, Run Defense: 66.9, Tackling: 61.5, Pass Rush: 65.0, Coverage: 66.7)
Cluster Summaries
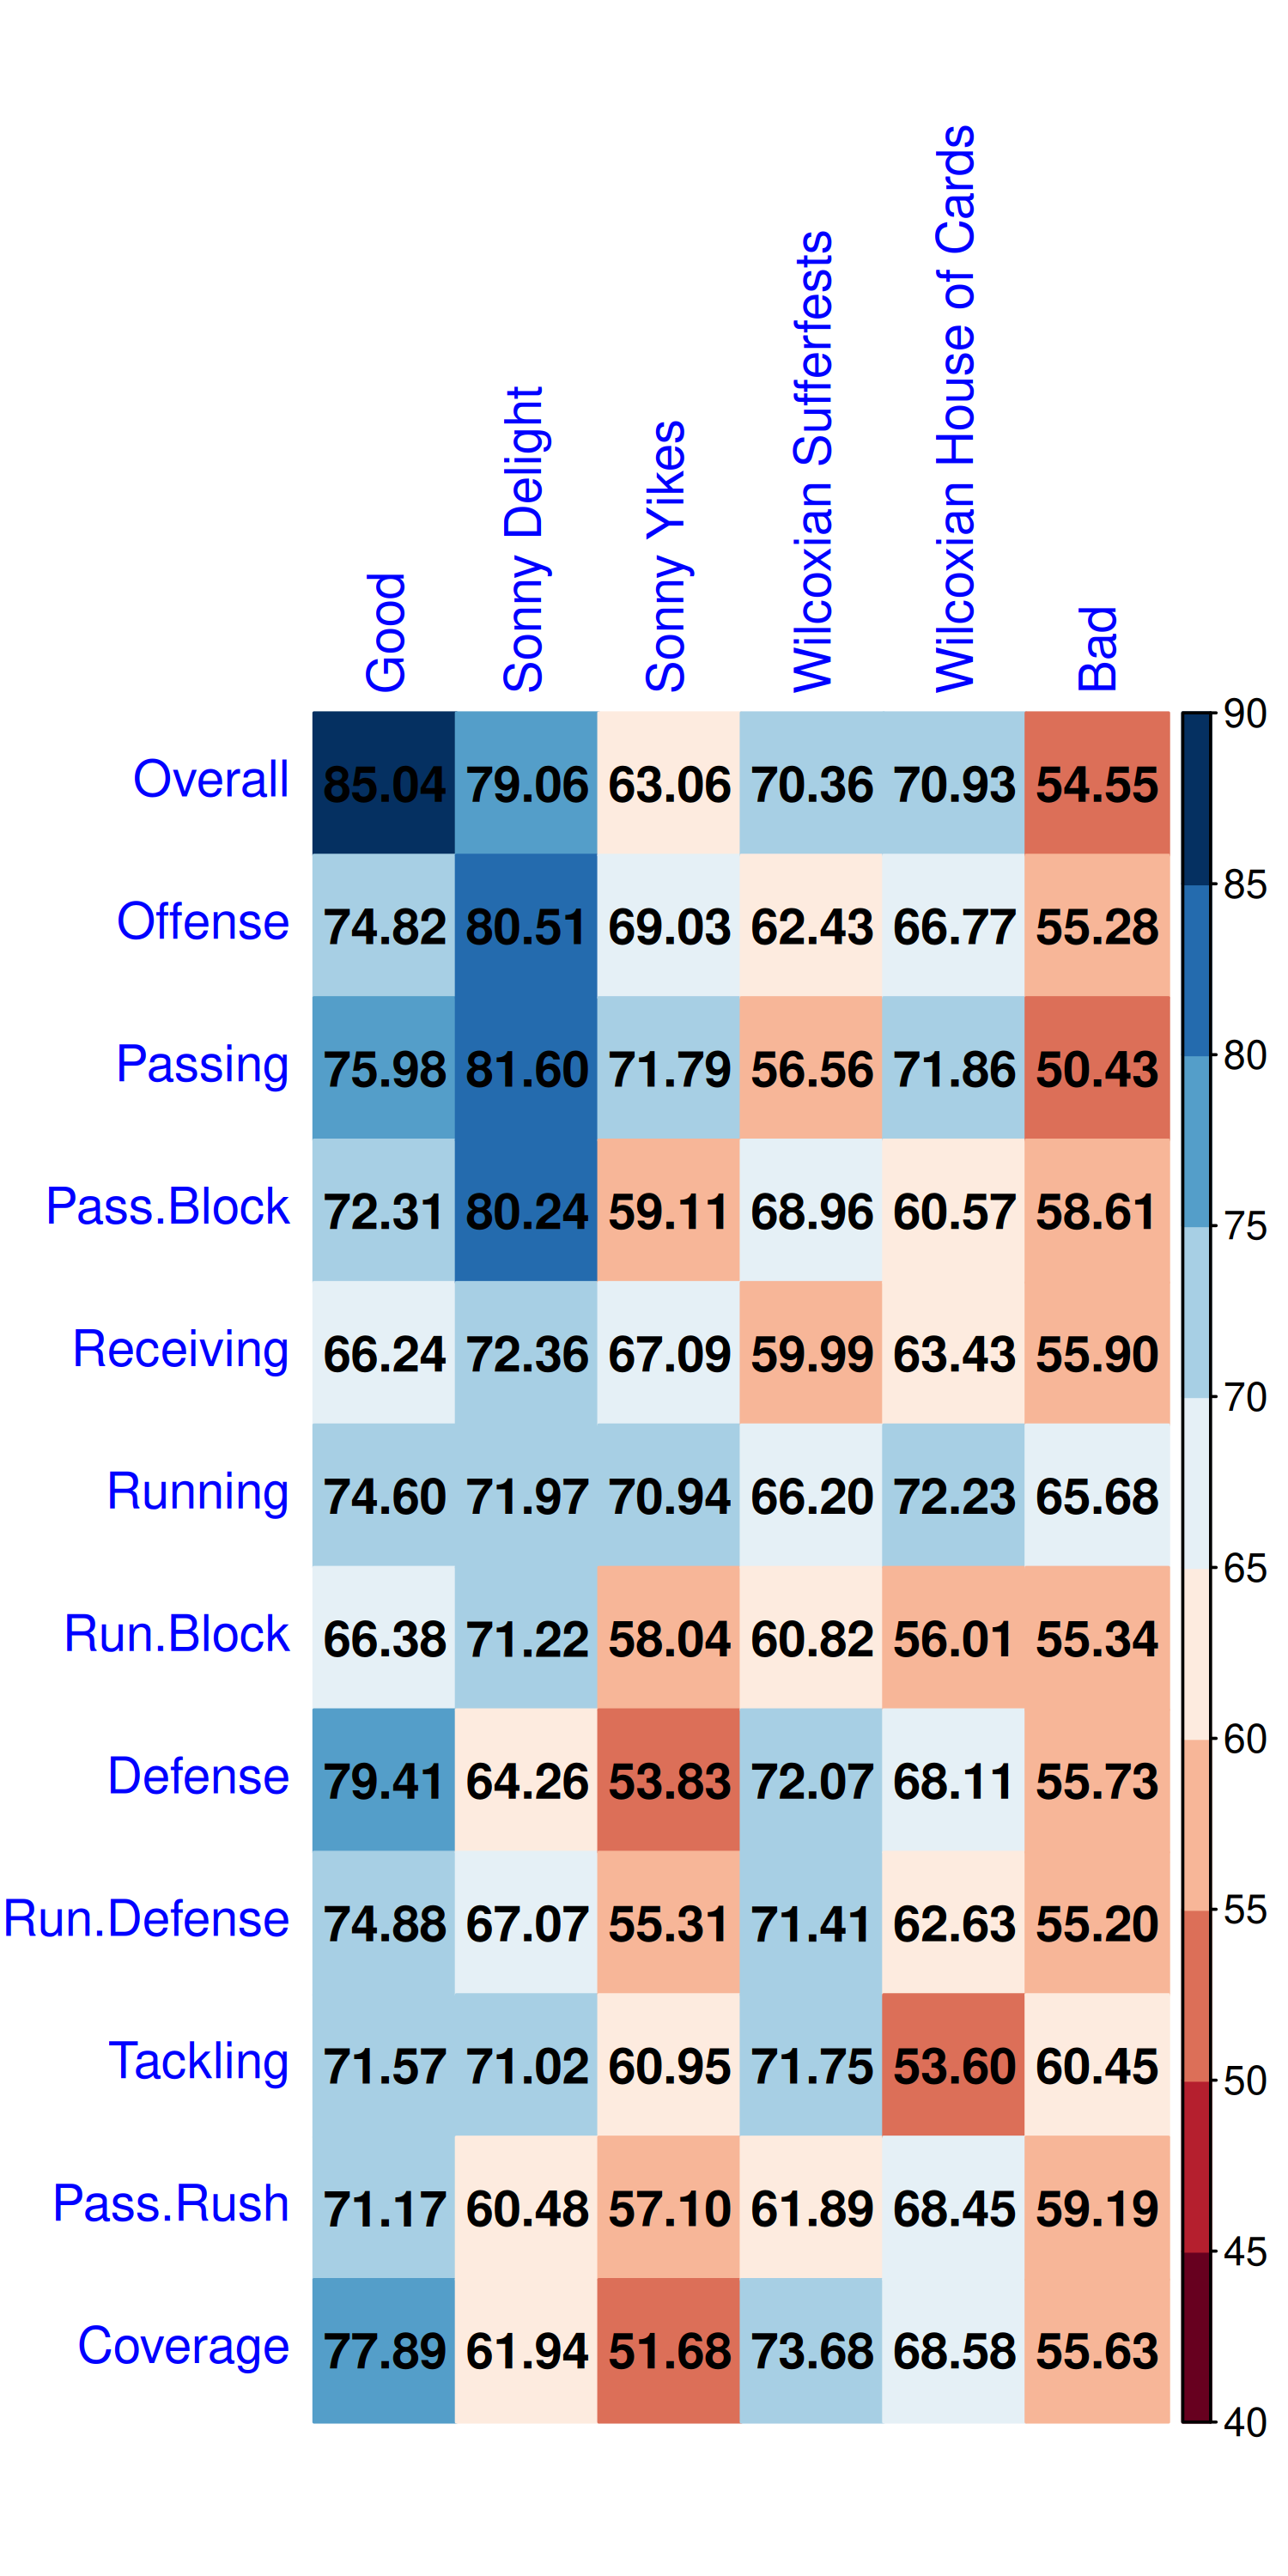
The following chart shows the average PFF grades in each cluster. Grades are color-coded with better grades filled with a darker blue while worse grades have a darker red. Some clear distinctions are visible between the clusters [I can and will reproduce the same plots showing how the raw data align with our new clusters].
A few interesting notes from the clusters’ grades:
The Sonny Delight offense is even better than the offense in The Good. When that offense was rolling, it was unstoppable.
On the other hand, the Sonny Yikes defense was even worse than the defense in The Bad. When that defense had a bad day, it had a very bad day.
Despite all the struggles by the offensive line under Wilcox, they tended to have decent days during his Sufferfest games. Unfortunately, the passing game was unable to lend any assistance to the reasonably successful ground game.
Sonny Yikes teams resemble Wilcox’s House of Cards teams but with much, much worse defense.
While the Sonny Dykes and Justin Wilcox teams felt very different, it is remarkable to see how the 2014-16 and 2017+ teams tend to occupy different places in the plot. These clearly were very different teams.
Where Have We Been?
In addition to looking at each game individually, we can take the average grade over the course of the whole season and see where that entire year fits within our flavors of Cal football games. First, the chart below shows the average grade for each category in comparison to all previous grades observed in our data (click for a larger version)
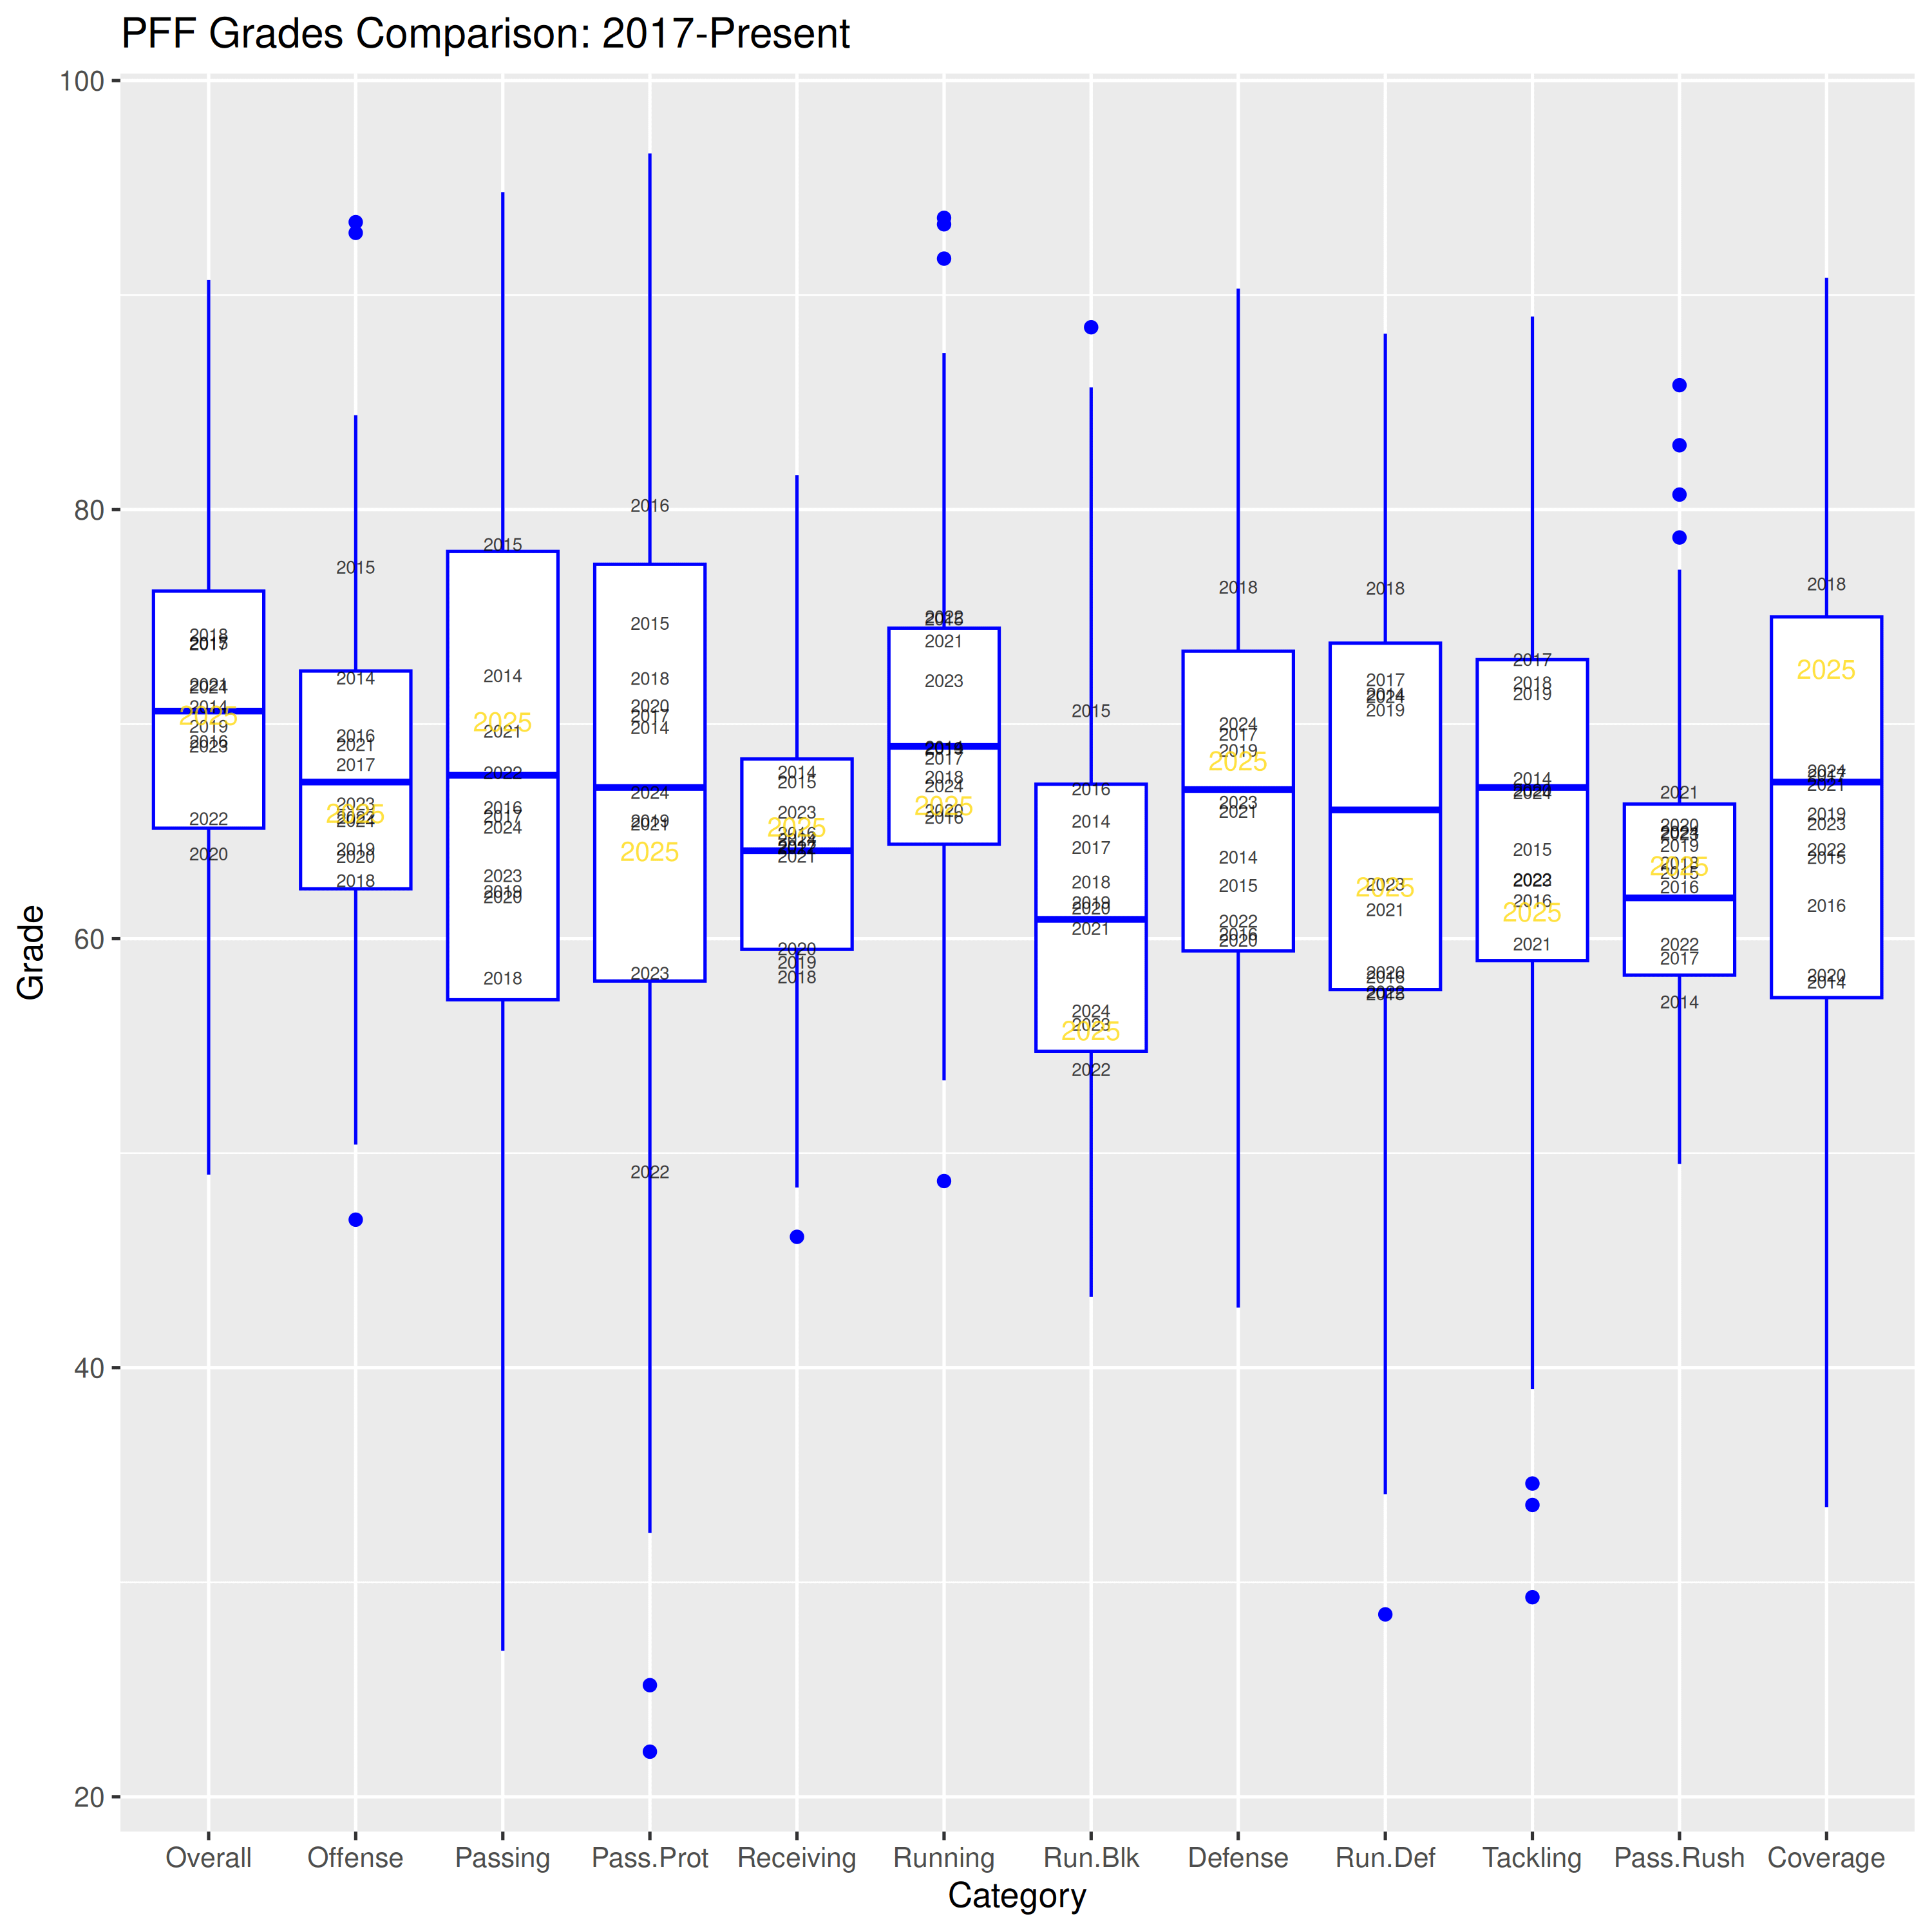
Each year represents the average grade in that category for that team. The larger boxplots represent the range of previous grades, where the box captures data between the 25th and 75th percentiles, and the horizonal line represents the median, or midpoint of the data [I’ve been describing boxplots to you lot for what feels like decades, so you better believe they’ll be back in our new data]. Those average grades were fed into our clustering algorithm to see where each season belongs in our set of clusters. Each season is highlighted with a rectangle around it (click the image for a larger version).
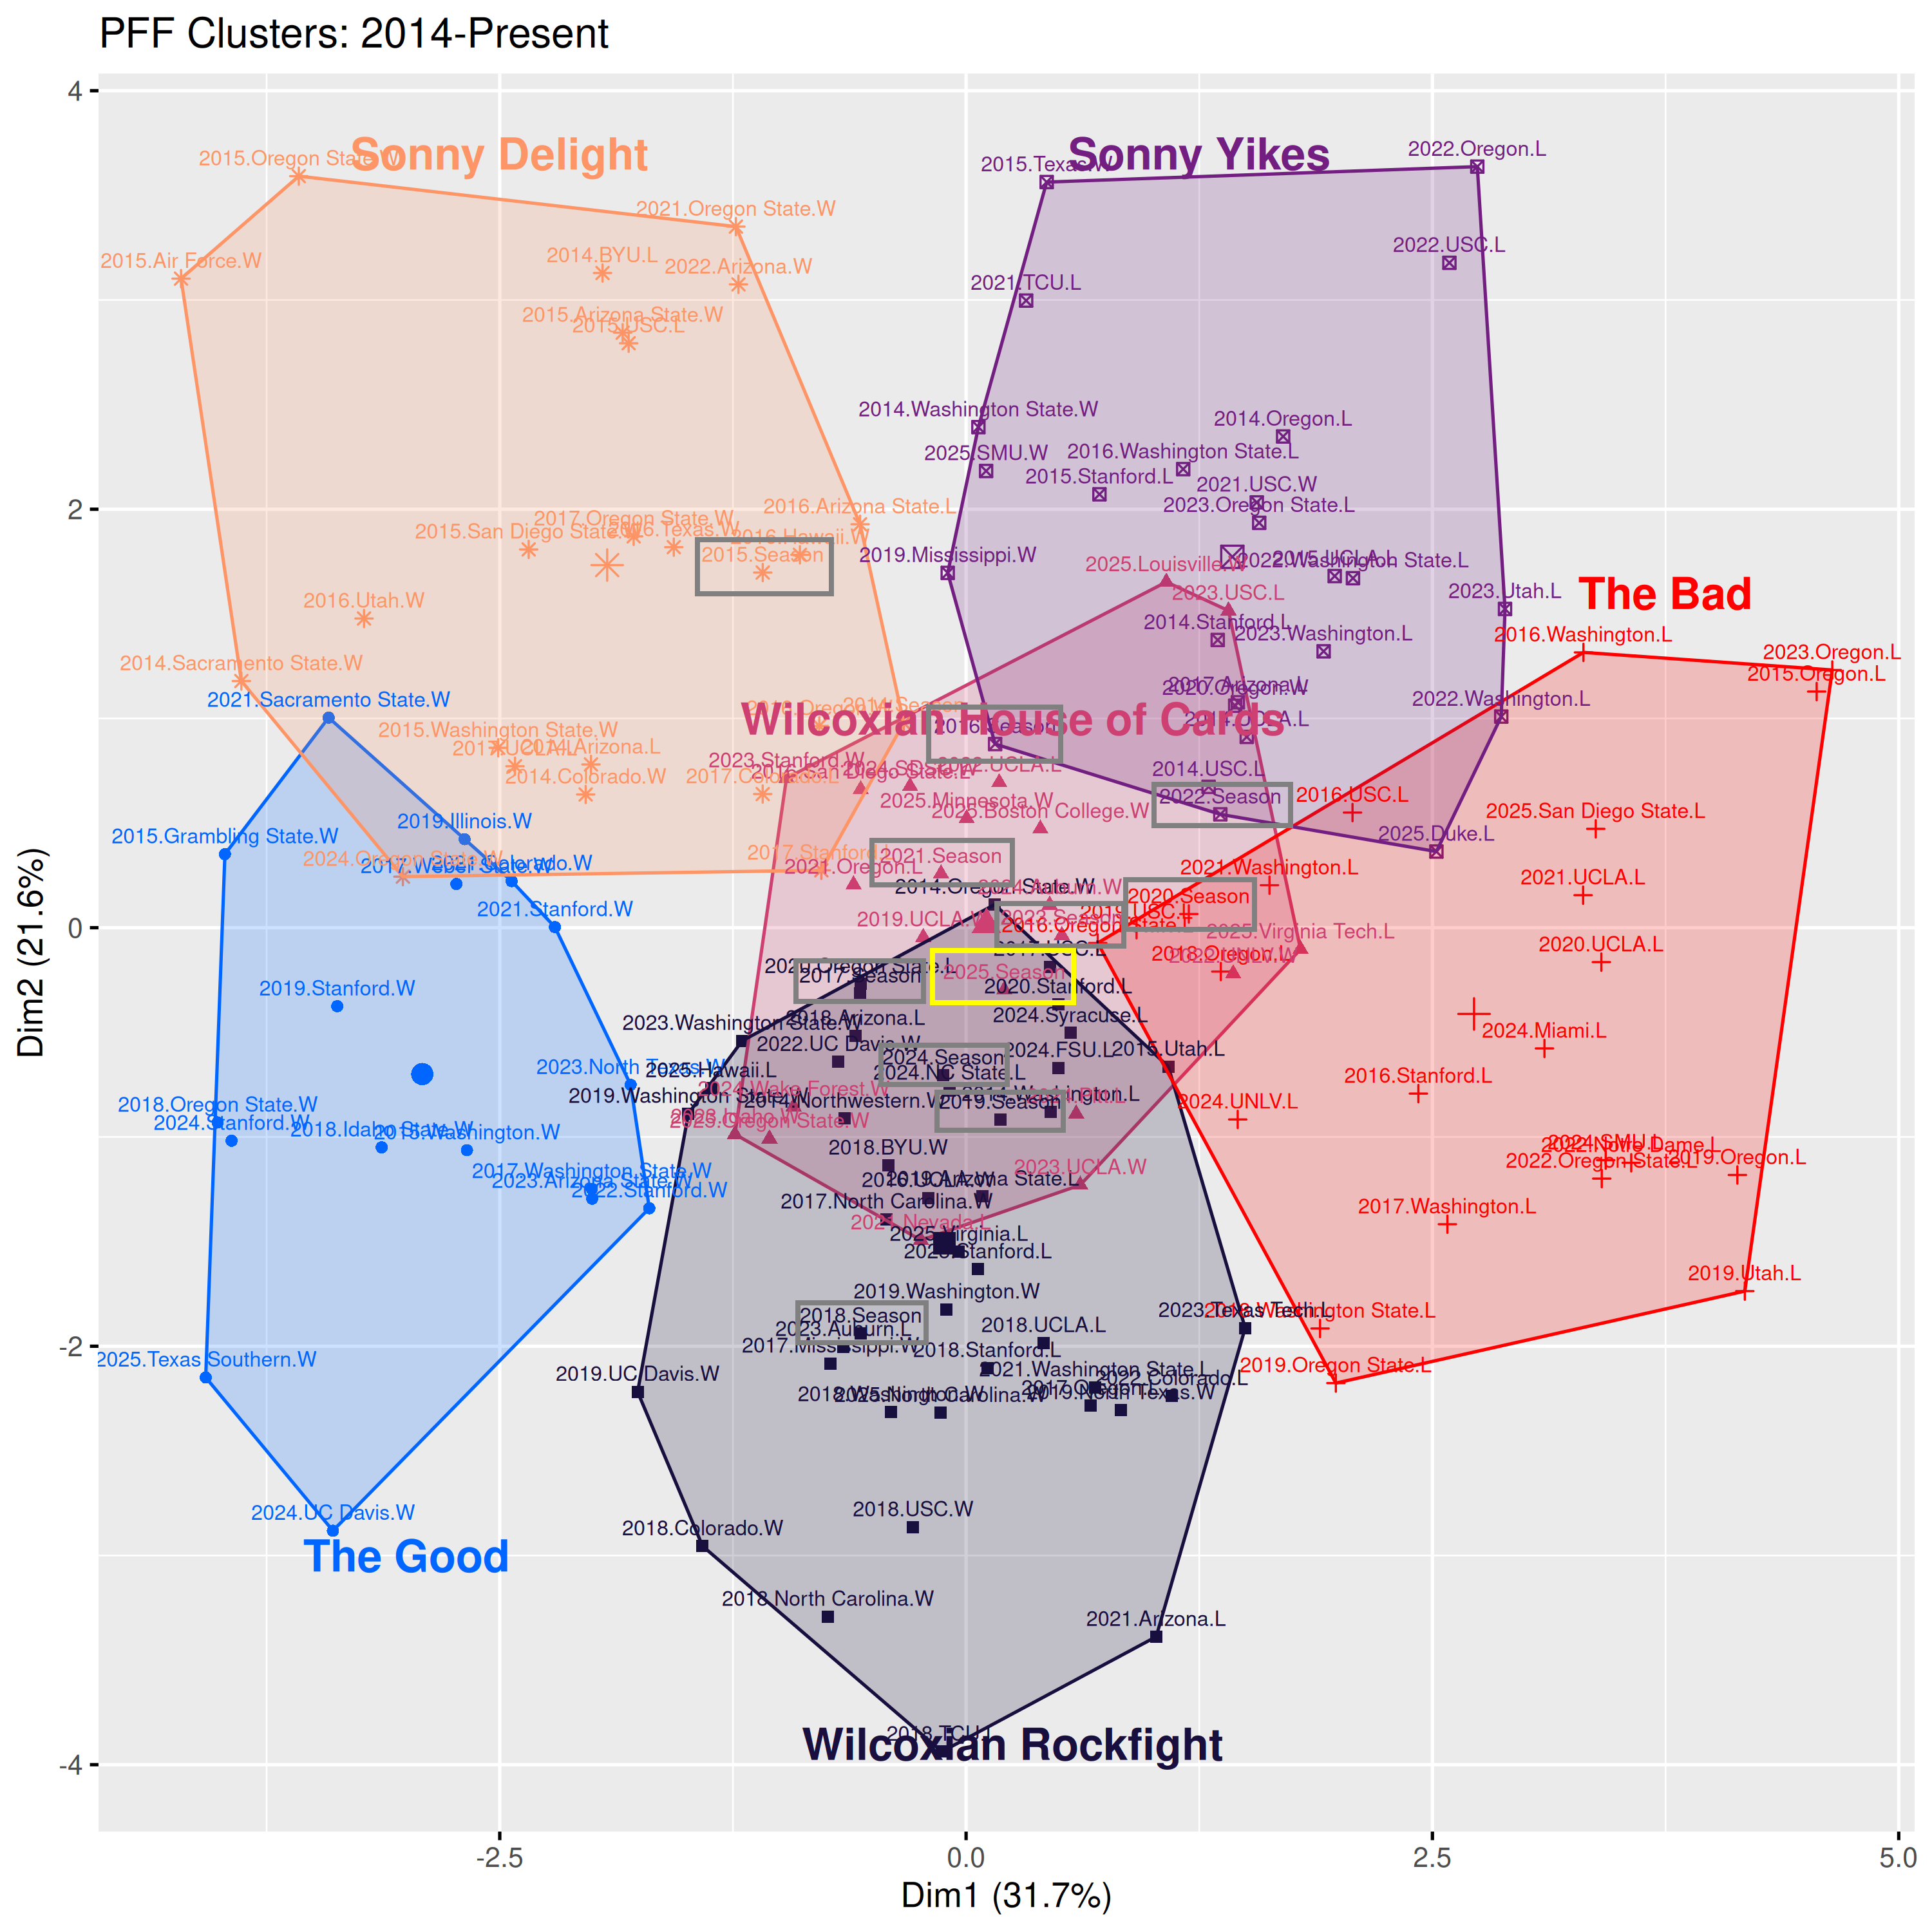
The last eleven seasons have unfoled as follows: 2015, Sonny Delight; 2016, Sonny Yikes; 2017-19, Wilcoxian Rockfights; 2020, The Bad; 2021, Wilcoxian House of Cards; 2022, Sonny Yikes; 2023, Wilcoxian House of Cards; 2024, Wilcoxian Rockfight; 2025, Wilcoxian House of Cards.
The last several years highlight the plateauing of the Wilcox Era, with three years of Rockfights followed by wavering back and forth among categories with fatal flaws (woeful blocking and tackling in House of Cards and woeful defense in Sonny Yikes and The Bad). The table below tallies the number of games in each cluster throughout the data set.
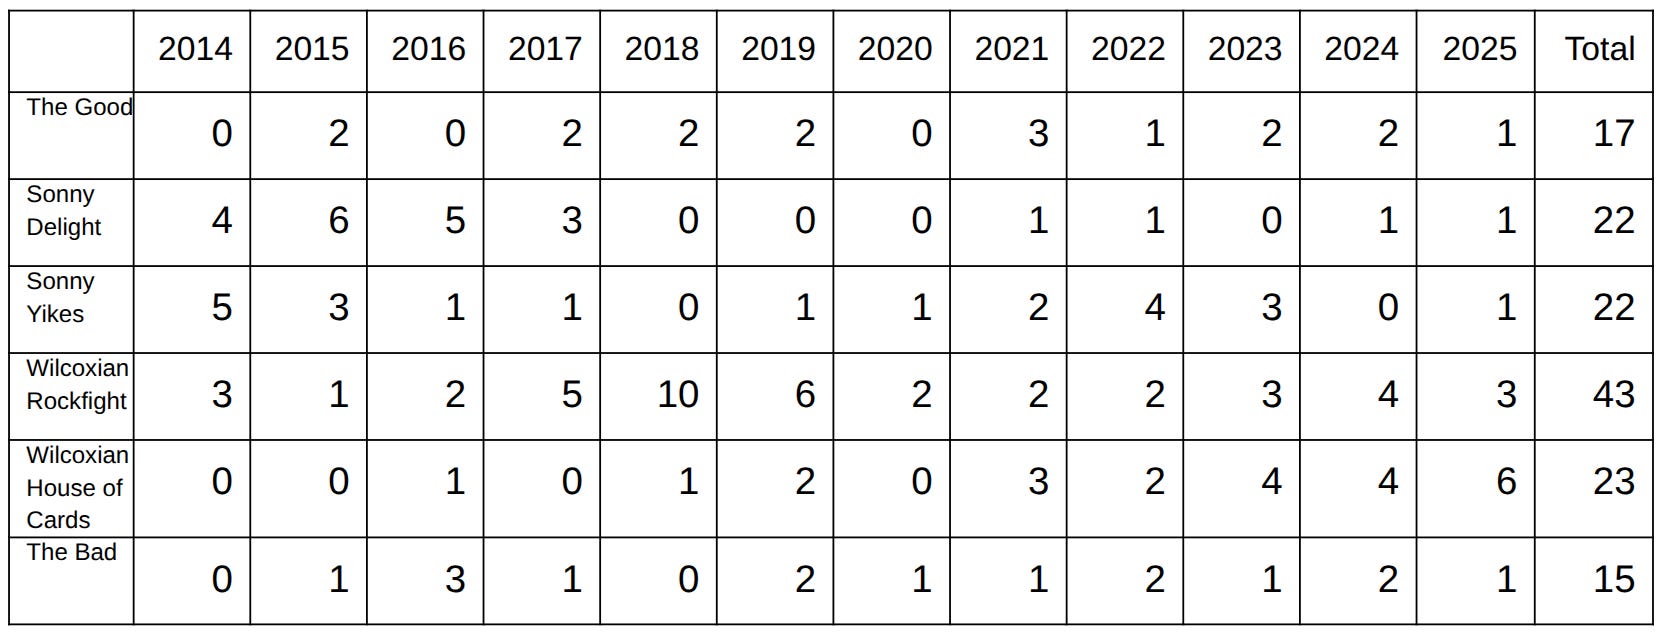
Sonny Yikes was the most common type of game in 2014, as the team was still recovering from the horrors of the Andy Buh defense. Sonny Delight was most common in 2015 and 2016, before a strong pivot to Wilcox’s Sufferfests from 2017-2020 (including TEN in 2018). The team’s identity changed distinctly after new offensive and defensive coordinators took over in 2021, with a surprising number of Sonny Yikes games. Declining performance on the offensive line and with tackling led the 2023-25 teams to be most often characterized by House of Cards.
Where Are We Going in 2026?
I have absolutely no idea [edit: doubly so, now that we need a new data source]. We have a near-complete turnover on staff and heavy roster turnover from 2025 to 2026, which stymies any attempt to forecast what kind of team Cal will be this season. Fortunately our trusty clustering algorithm can take each game’s performance, ingest it, and tell us what kind of past Cal football teams this one most closely resembles [again, I can use the same algorithm to sort our new data, although the number of clusters and the flavors of those clusters will likely change]. By the end of September we should have some idea of what kind of team we have for the 2026 Cal football season—that or the grades will all be such outliers that this team will defy all attempts at categorization. In any case, check back weekly in The Good, The Bad, and The Rockfights to find out!
For a data geek like me, this was heaven! Thank you. One note: for the first 2 years of the Dykes regime, EVERY GAME felt like a SONNY YIKES. It was very hard to watch Cal go down by 21+ points in the first half week after week, only to see the GBs score garbage time points to make it look like a real game...
Eff da greedy bastids in da A