2021 Cal Football Season in Review: Did the Bears Meet Expectations?
Or, how to say "no" in a variety of charts and tables.
The 2021 Cal football season was…eventful. Some good things happened (Big Game blowout win, upsetting Oregon State), some bad things happened (the entire first half of the season), and some unspeakable things happened (Tucson remains a house of unimaginable horrors). We’re now a few months removed from the season; the emotional highs and lows have largely ebbed, and we can now look back on the year with some semblance of objectivity. Did the Bears meet our expectations? Of course not, what a silly question.
Alas, the powers that be at Write for California have made it clear that the last paragraph is insufficient to warrant publication and I need to make some substantial additions lest I sully the name of this community and destroy all editorial integrity we have built over the years. So let’s look a little more closely at our expectations for the Bears in 2021 and how the season unfolded, and try to reconcile the two.
How Did our Preseason Expectations Compare to the Bears’ 5-7 Record?
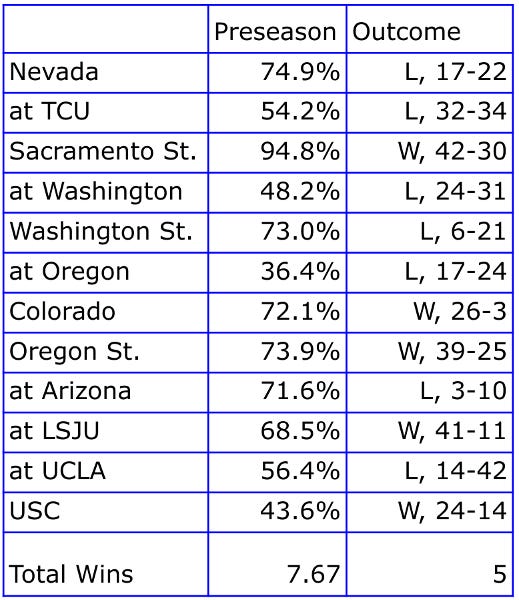
Prior to the season I asked you all to participate in our biannual season predictions in which we rate the Bears’ chances of defeating each opponent on the schedule. After many submissions from our intelligent, attractive, and not-at-all bias-prone readers, I determined that we expected a whopping eight wins in 2021. Okay, 7.67 rounded up, but still. Expectations have not been this high since the late aughts.
And, well, this is how it unfolded.
On the left we have each opponent, followed by our assessment of the Bears’ chances of winning, and the actual outcome. The good news is that we notched an upset, as we had low expectations of a win over USC at the start of the year (isn’t it a shame that they don’t have a website as brilliant as ours where we could read a similar article about how they failed to meet expectations? Oh the schadenfreude! Instead, all they got was a looming juggernaut on the horizon as Lincoln Riley slowly assembles a death star). The bad news is that the Bears went 4-5 in the nine games in which they were favorites. Worse yet, they went 2-3 in the five games where we gave them a 70+% percent chance of winning. Ouch.
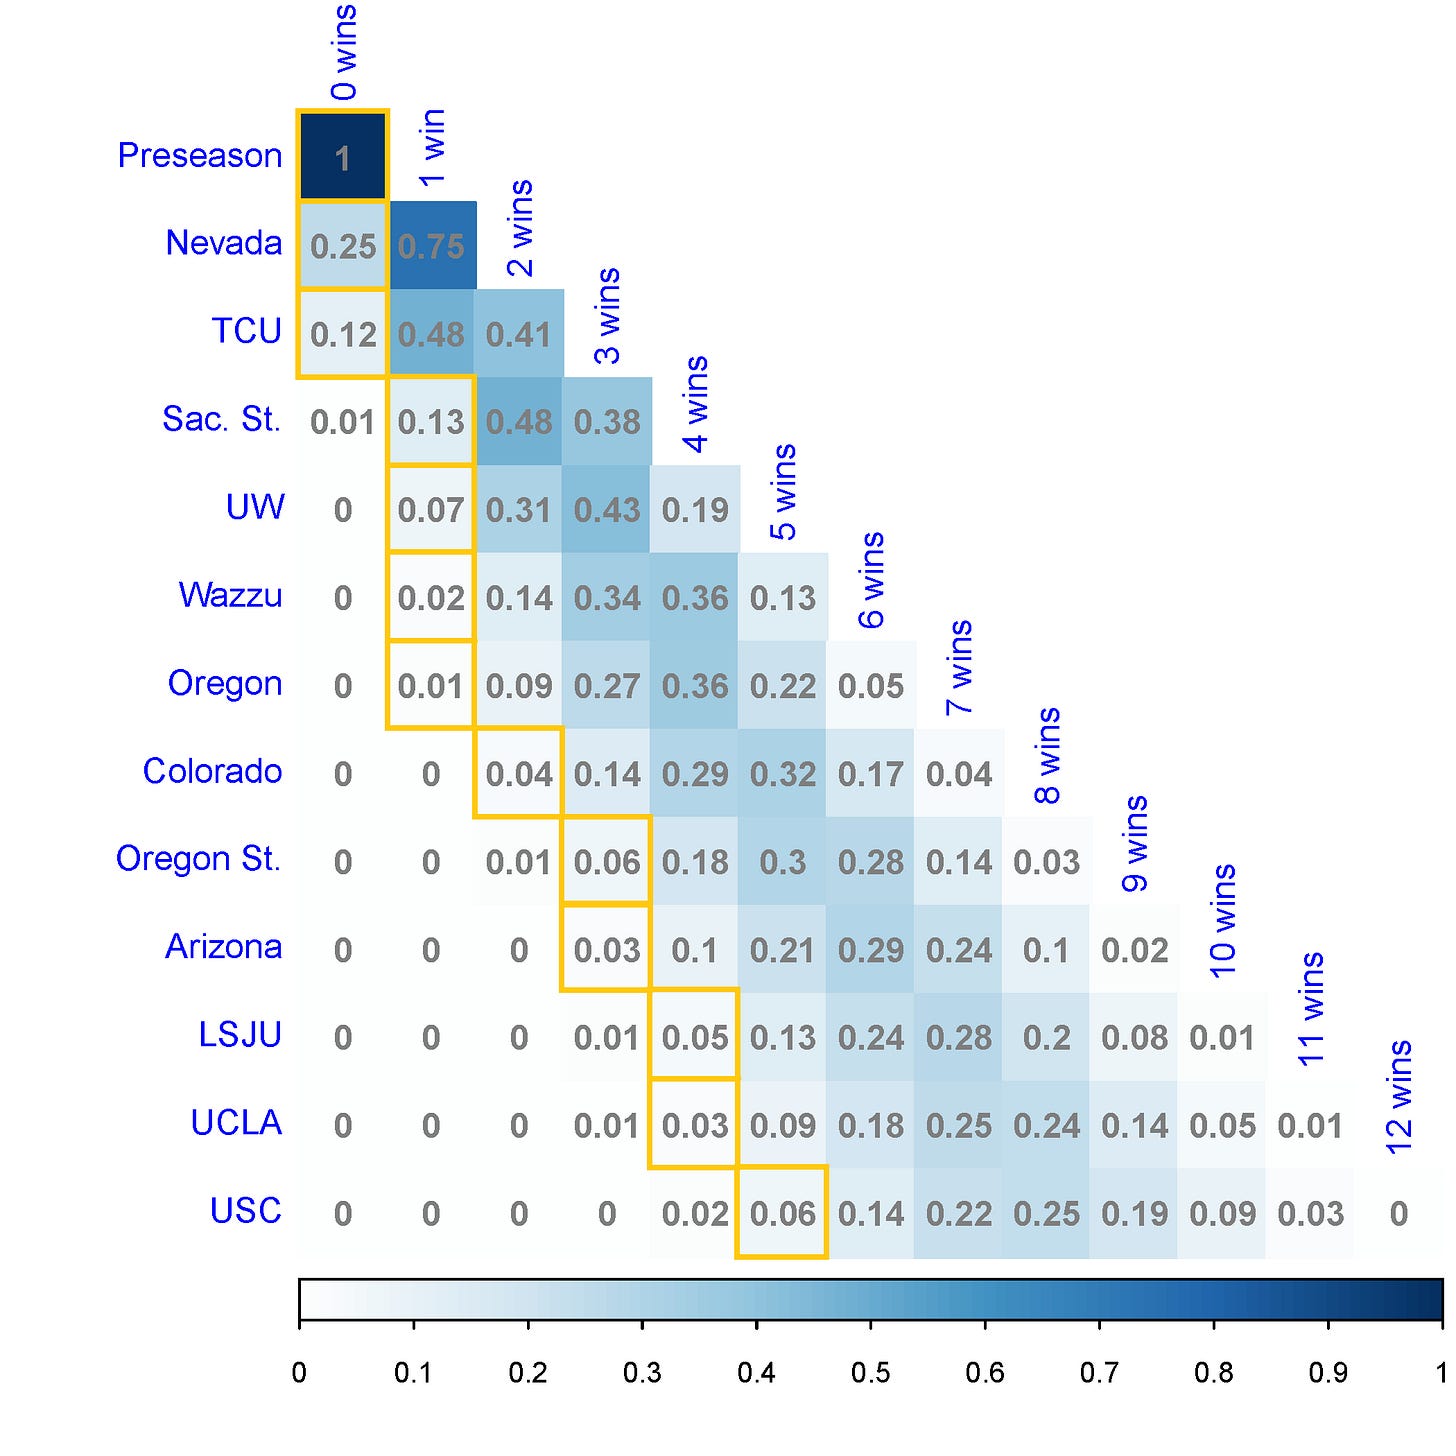
Based on those predictions I was able to simulate how likely the Bears were to achieve all possible outcomes after each game: 1-0 vs. 0-1 after Nevada, 2-0 vs. 1-1 vs. 0-2 after TCU, and so on. In the figure below, likelier outcomes are darker blue while less likely outcomes are lighter. And the number indicates the probability of each outcome. I’ve superimposed a gold box showing Cal’s position after each game. Unfortunately, it was a very unlikely year in all the wrong ways.
Clearly the Bears fell well short of preseason expectations. But are we unfairly punishing a team that went 0-5 in its one-score games? Flip half of those and we have a 7- or 8-win season. Flip them all around and the Bears finish 10-3, and we would be having a very different discussion right now. What if there was some way that we could take final scores into account when seeing how well the Bears fared this year?
How Did Our Preseason Expectations Compare to Score Differentials?
Fortunately, there is: The Pythagorean Expectation, a formula that uses score differentials to estimate how many games a team should have won over the course of the season. Originally developed for baseball, the equation was adapted to football by Football Outsiders. They determined that the equation should be as follows:
Win likelihood = (points scored^2.37) / (points scored^2.37 + points allowed^2.37)
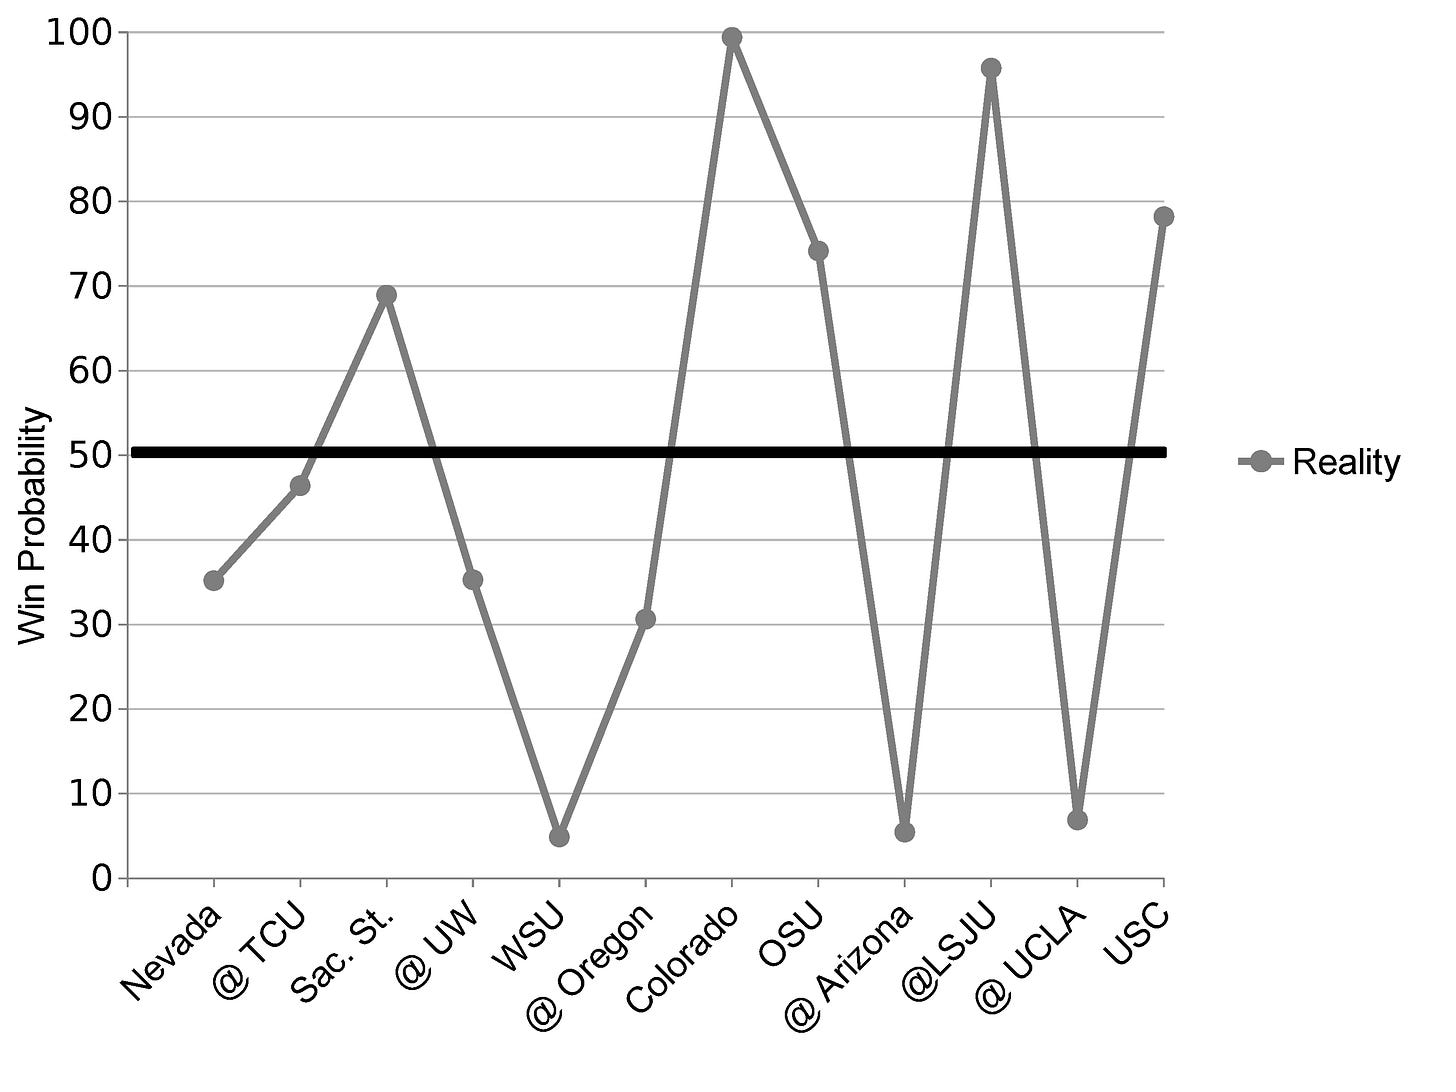
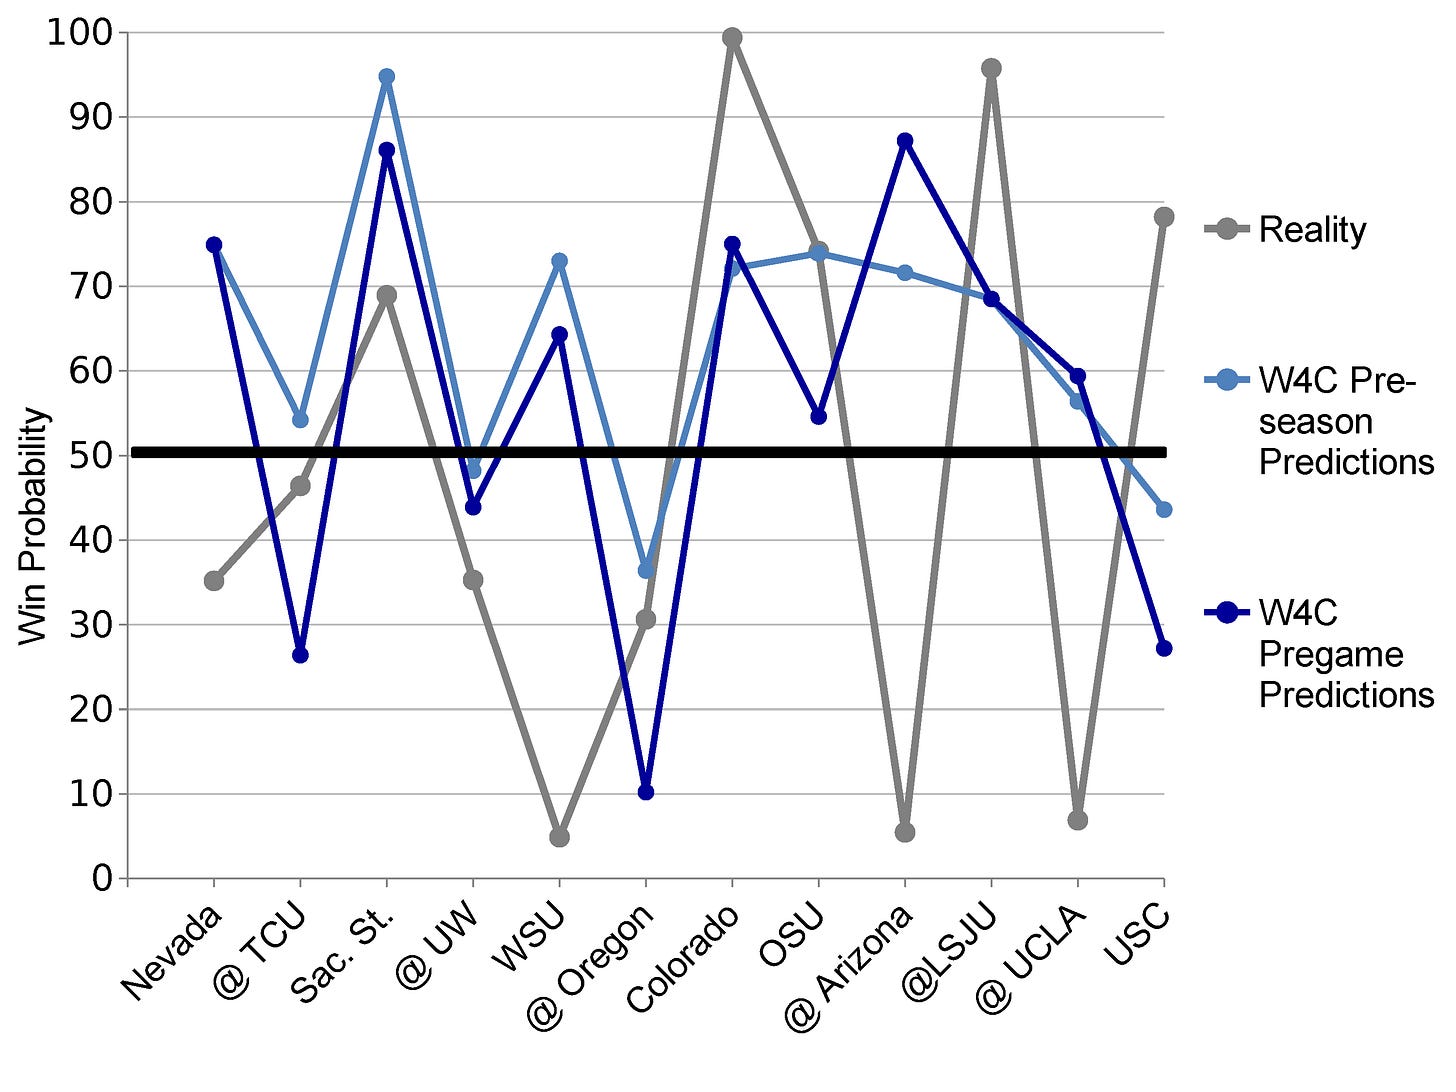
If we use the Pythagorean Expectation on each game, we get the following win chances based on the final scores (note: the formula gets a little wonky for low-score games like the Arizona game). I’ve plotted those predictions game-by-game with win probabilities on the y-axis.
Other than the Wazzu blowout, the final scores suggested that the Bears had a reasonable chance of winning some of those losses in the first half of the year. Each of those losses fell in the 30-45% range. And you don’t have to spend much time in Evans Hall (RIP) to figure out that going 0-for-4 in a series of 1/3 probability coin flips is rather unlucky.
The second half of the season was wacky as each game’s winner had a 75% chance or more based on the final score (and four of those were 90+%!). Again, that Arizona game is a little odd based on that low final score is, but, well, let’s just stop thinking about the Arizona game. Based on the bipolar nature of those games, it’s hard to say the Bears suffered much bad luck in the second half of the year.
Adding up all those score-based probabilities gives us 5.81 projected wins. Obviously that’s a bit above the team’s 5 wins, suggesting the Bears had some bad luck. But it’s well below the 7.67 wins we predicted at the beginning of the year. Based on the final scores, the Bears fell nearly 2 wins short of our preseason expectations.
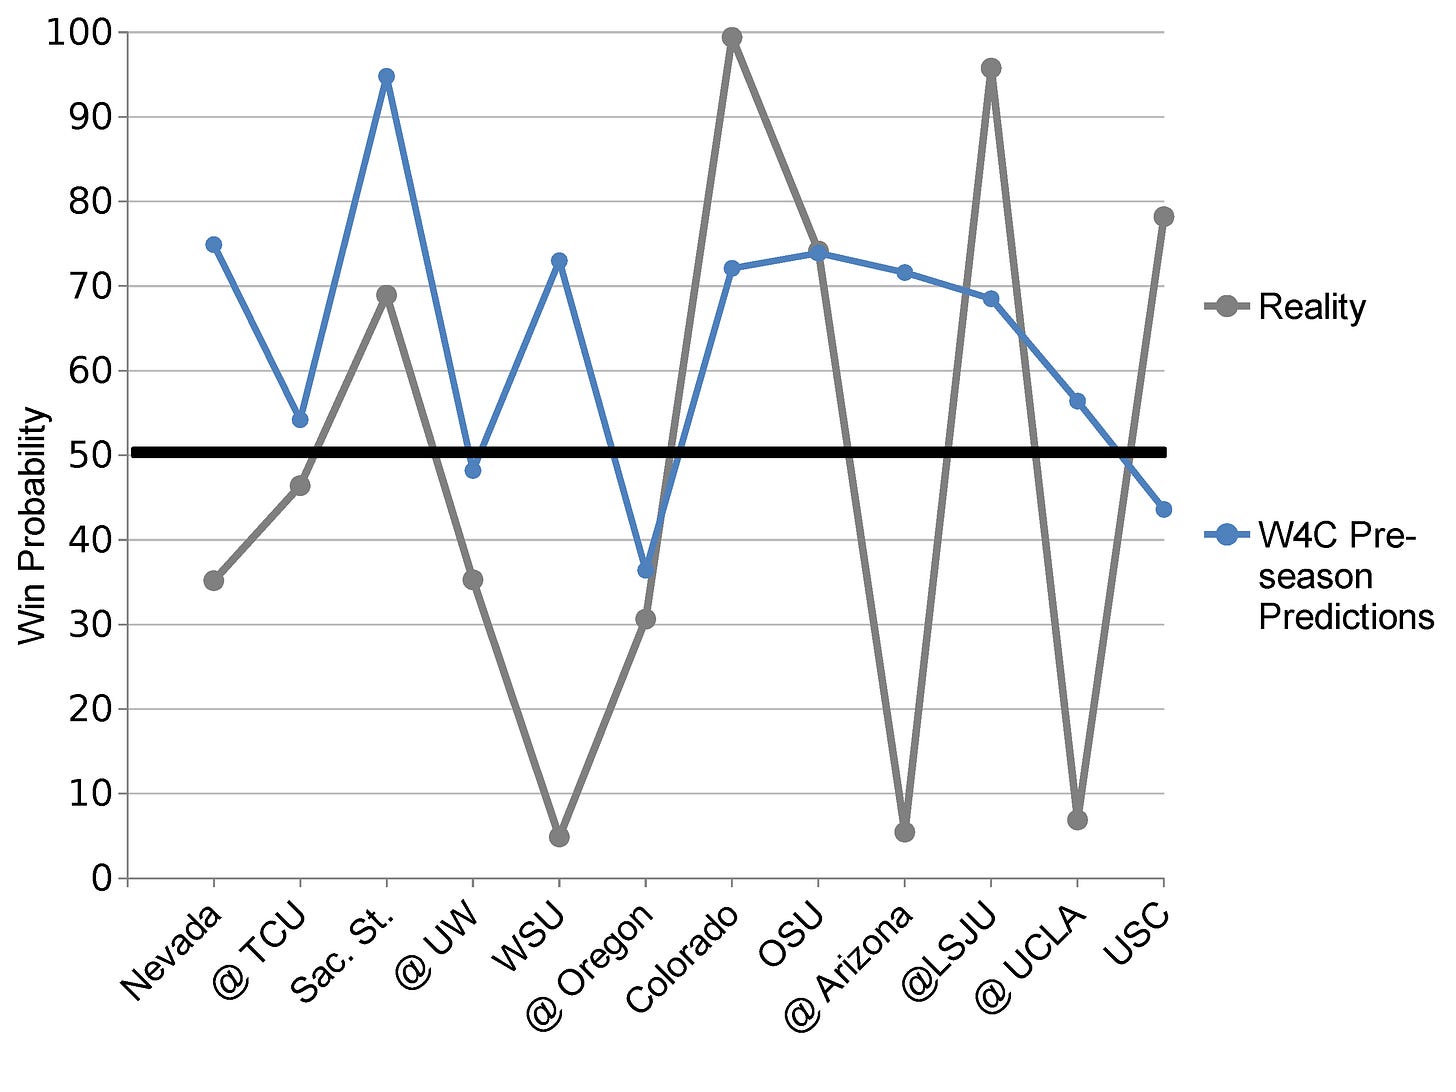
Comparing the reality-based outcome and our preseason predictions provides some useful insight. Where the preseason prediction was higher than reality, the Bears underachieved; where reality was higher than our preseason prediction, the Bears overachieved.
Following that logic, the Bears underachieved in every one of the first-half games. Then, in the second half of the season they fluctuated wildly between substantial overachievment and atrocious underachievement. All except for the OSU game, which aligned nearly identically with our preseason expectations. In sum, the Bears met expectations in 1 game, overachieved 3 times (all by large margins), and underachieved 8 times (3 times by small margins and 5 times by large margins).
How Did Our Pregame Predictions Compare to Score Differentials?
One challenge with preseason expectations is that we can’t update our predictions with each game. After the Nevada loss, many of us probably recalibrated our expectations for the year. And we kept setting our expectations lower and lower after each of the games in the 1-5 start. So next we’ll look at our pre-game predictions as measured in our weekly Rating the Bears series. The pre-game predictions below are dark blue compared to the light blue of our preseason predictions.
Our pregame predictions can be rather volatile overreactions to the most recent game, but we generally lowered expectations compared to preseason predictions. In fact, the projected number of wins based on the pregame predictions was 6.78, a full win below our preseason predictions. But that’s still 1.78 wins above reality. So even after accounting for our revised predictions, the Bears underachieved.
How Did Las Vegas’ Predictions Compare to Score Differentials?
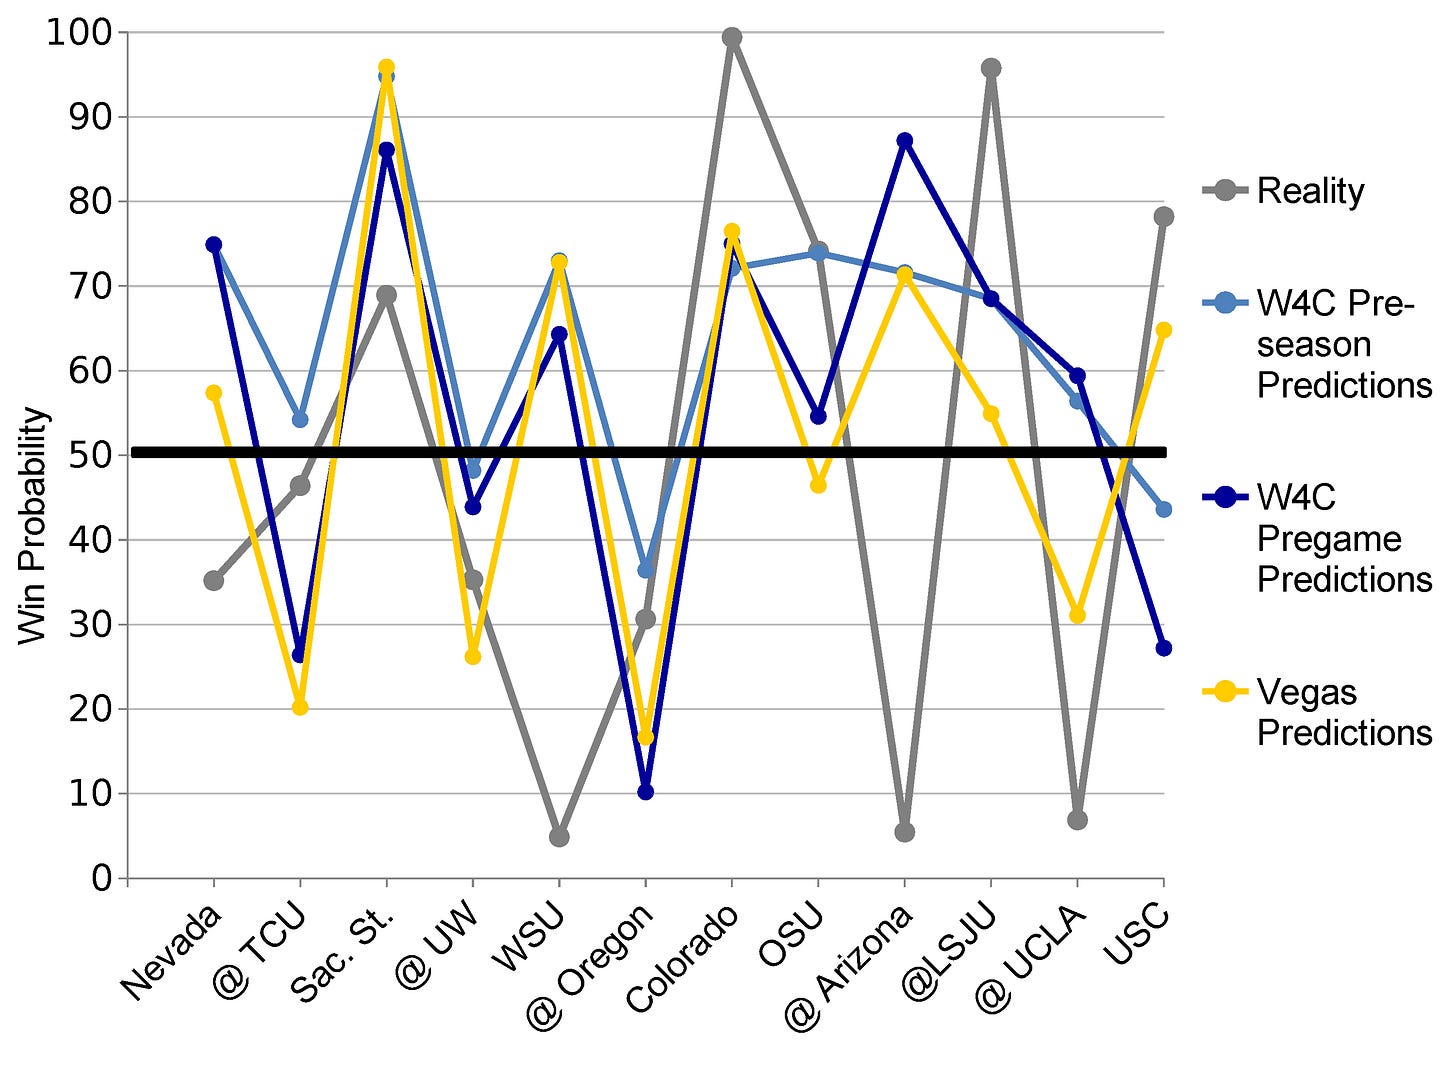
While we’re all a bunch of insufferable homers, perhaps the oddsmakers in Vegas had more reasonable expectations of the Bears. I used the money line from each game to calculate Vegas’ predictions of how the Bears would fare in each game. Those are below in gold.
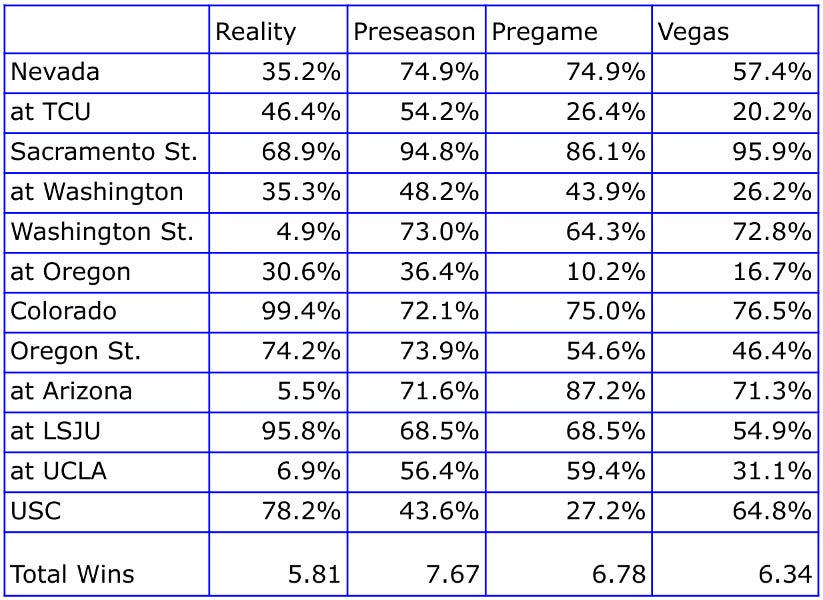
Over the first half of the season, Vegas’ predictions look quite similar to our pregame predictions: they typically only disagree by about 5-15 percentage points. Once the Bears recovered from their death spiral, our pregame predictions tended to be consistently about 15-20 percentage points more optimistic than Vegas (except for the USC game). In sum, Vegas’ odds expected 6.34 wins from the Bears. Again, the Bears fell more than a game short of that outcome. However, Vegas was only off by about a half game compared to the wins expected based on the score differentials. You can compare reality and all three predictions for each game in the table below:
No matter whose predictions you use—our preseason predictions, our pregame predictions, or Vegas’ odds—the Bears failed to meet expectations. Some bad luck certainly played a role here: during the 1-5 start the Bears should have had 2.2 wins based on the final scores. And that fell well short of the 3.81 wins over that same stretch from our preseason predictions, the 3.05 wins from our pregame predictions, and the 2.89 wins expected by Vegas over that same time span. If the Bears had turned that 1-5 start into a 3-3 start, they would have been much closer to the 7.67 wins we expected from them at the start of the year.
If there’s a silver lining here, it’s that the Bears slightly overachieved in the second half of the year. They posted a 4-2 finish despite score differentials suggesting they should have won 3.6 games, our preseason predictions projecting that they’d win 3.86 games in that stretch, our pregame projections of 3.71 wins, and Vegas’ projections of 3.45 wins. After suffering a mid-season or late-season slide in seemingly every year in recent memory, the Bears finally managed to exceed expectations in the second half of the year. It’s just a shame that they so woefully underachieved in the first half of the season. While the Bears failed to meet our expectations this season due to that atrocious 1-5 start, they were able to course-correct and meet expectations in the second half of the year.


The bottom line is that Wilcox could not produce a winning record with a senior laden team in maybe the worst year the Pac 12 has ever seen. USC and Washington fired their head coaches because of it, and Oregon State sent their defensive coordinator packing in mid season because they stopped tackling. Cal gives Wilcox a 4-year extension after his fifth straight season of a losing record in conference. I mean, where else does that happen? And don't say Rich Brooks in his early years at Oregon. Head coaches were not making $3 mil a year in that era.
You deserve credit for doing such a thorough analysis of such a thoroughly wrought and distraught season. Sports is sports in that the score is what matters. We are more Charlie Brown than most any school I can think of. I know I'm Charlie Brown, but I keep running to kick the ball. Woe is me. Lucky me!