


Welcome back to The Good, the Bad, and the Rockfights, our weekly exercise in copy+pasting last week’s analysis, changing two or three words, and publishing it again because this team turns in the same performance every week. Actually, we’re taking an unusual turn into the depths of despair this week, because I feel like I have written the same piece every week recently and I need to do something different. Recall that nearly every time we have run this series this season, the previous game has been categorized into The Bad (Virginia Tech was a Pillowfight and we didn’t evaluate Wagner because FEI does not produce drive data for FCS games). Once again, Cal has fallen into the Bad this week. But we’re diving deeper into the category and exploring the depths of the Bad by breaking it out into the Bad, the Worse, and the Dumpster Fires. Which cursed category did Cal fall into this week? Read on to find out.
Glossary
Want to know what kinds of Cal football games we’re currently identifying, what BCF Toys’ drive ratings measure, or how to read the Good-Bad-Rockfight-Pillowfight chart? This section should answer any questions you have about the plots and analysis. Otherwise, skip ahead to the plots.
Types of Cal football games
Good: Cal moves the ball productively and efficiently, and turns possessions into points. Meanwhile the defense stops the opponent’s drives early and prevents scoring opportunities.
Bad: The opposite of The Good: Cal can’t move the ball well or efficiently and cannot turn possessions into points. Meanwhile the defense surrenders many yards, long plays, and points.
Rockfight: These are led by strong defensive performances where the defense forces the opponent to grind out inefficient drives that usually end in a punt or turnover. Meanwhile, the offense replicates that struggle. These games are usually dictated by the rule of 21: first team to score 21 wins.
Pillowfight: both offenses can do whatever they want while the defenses are powerless to stop them. These are high-scoring shootouts that are usually decided in the waning minutes of the 4th quarter.
Plots
Boxplots: a boxplot illustrates the spread of data points. The plots used in this series highlight the most recent game’s rating in gold while the remainder of the data points are represented in the boxplot. The box captures data between the 25th and 75th percentiles while the horizontal line represents the median, or midpoint of the data. tl;dr: above the box = great, above the line = good, below the line = bad, below the box = turrible.
Cluster diagram: this illustrates our Good, Bad, Rockfights, and Pillowfights clusters. Each data point represents a game, and points closer together received more similar ratings while points farther apart received more dissimilar ratings. We use a k-means clustering algorithm to organize the games into four distinct clusters, which are color-coded in the plot.
BCF Toys Ratings
(the same ratings are used for offense and defense, so I will only define them once)
Game Rating (GR): opponent-adjusted FEI offense rating, capturing the expected scoring advantage the offense had against the opposing defense (and vice versa, for the defensive rating)
Efficiency (Eff): same as Game Rating, but the scoring advantage against an average defense
Points per Drive (PPD): points per drive during regulation, non-garbage time possessions (or opponent’s PPD, for the defensive rating)
Success Rate (SR): percentage of non-garbage time drives ending in a TD or FG attempt
Yards per Play (YPP): yards per play on non-garbage time possessions
Available Yards (AYd): the distance covered on a drive divided by the distance to the end zone when the drive began for non-garbage time possessions (basically, the proportion of the field covered during a possession)
Offense
First, a look at how well the Cal offense performed.
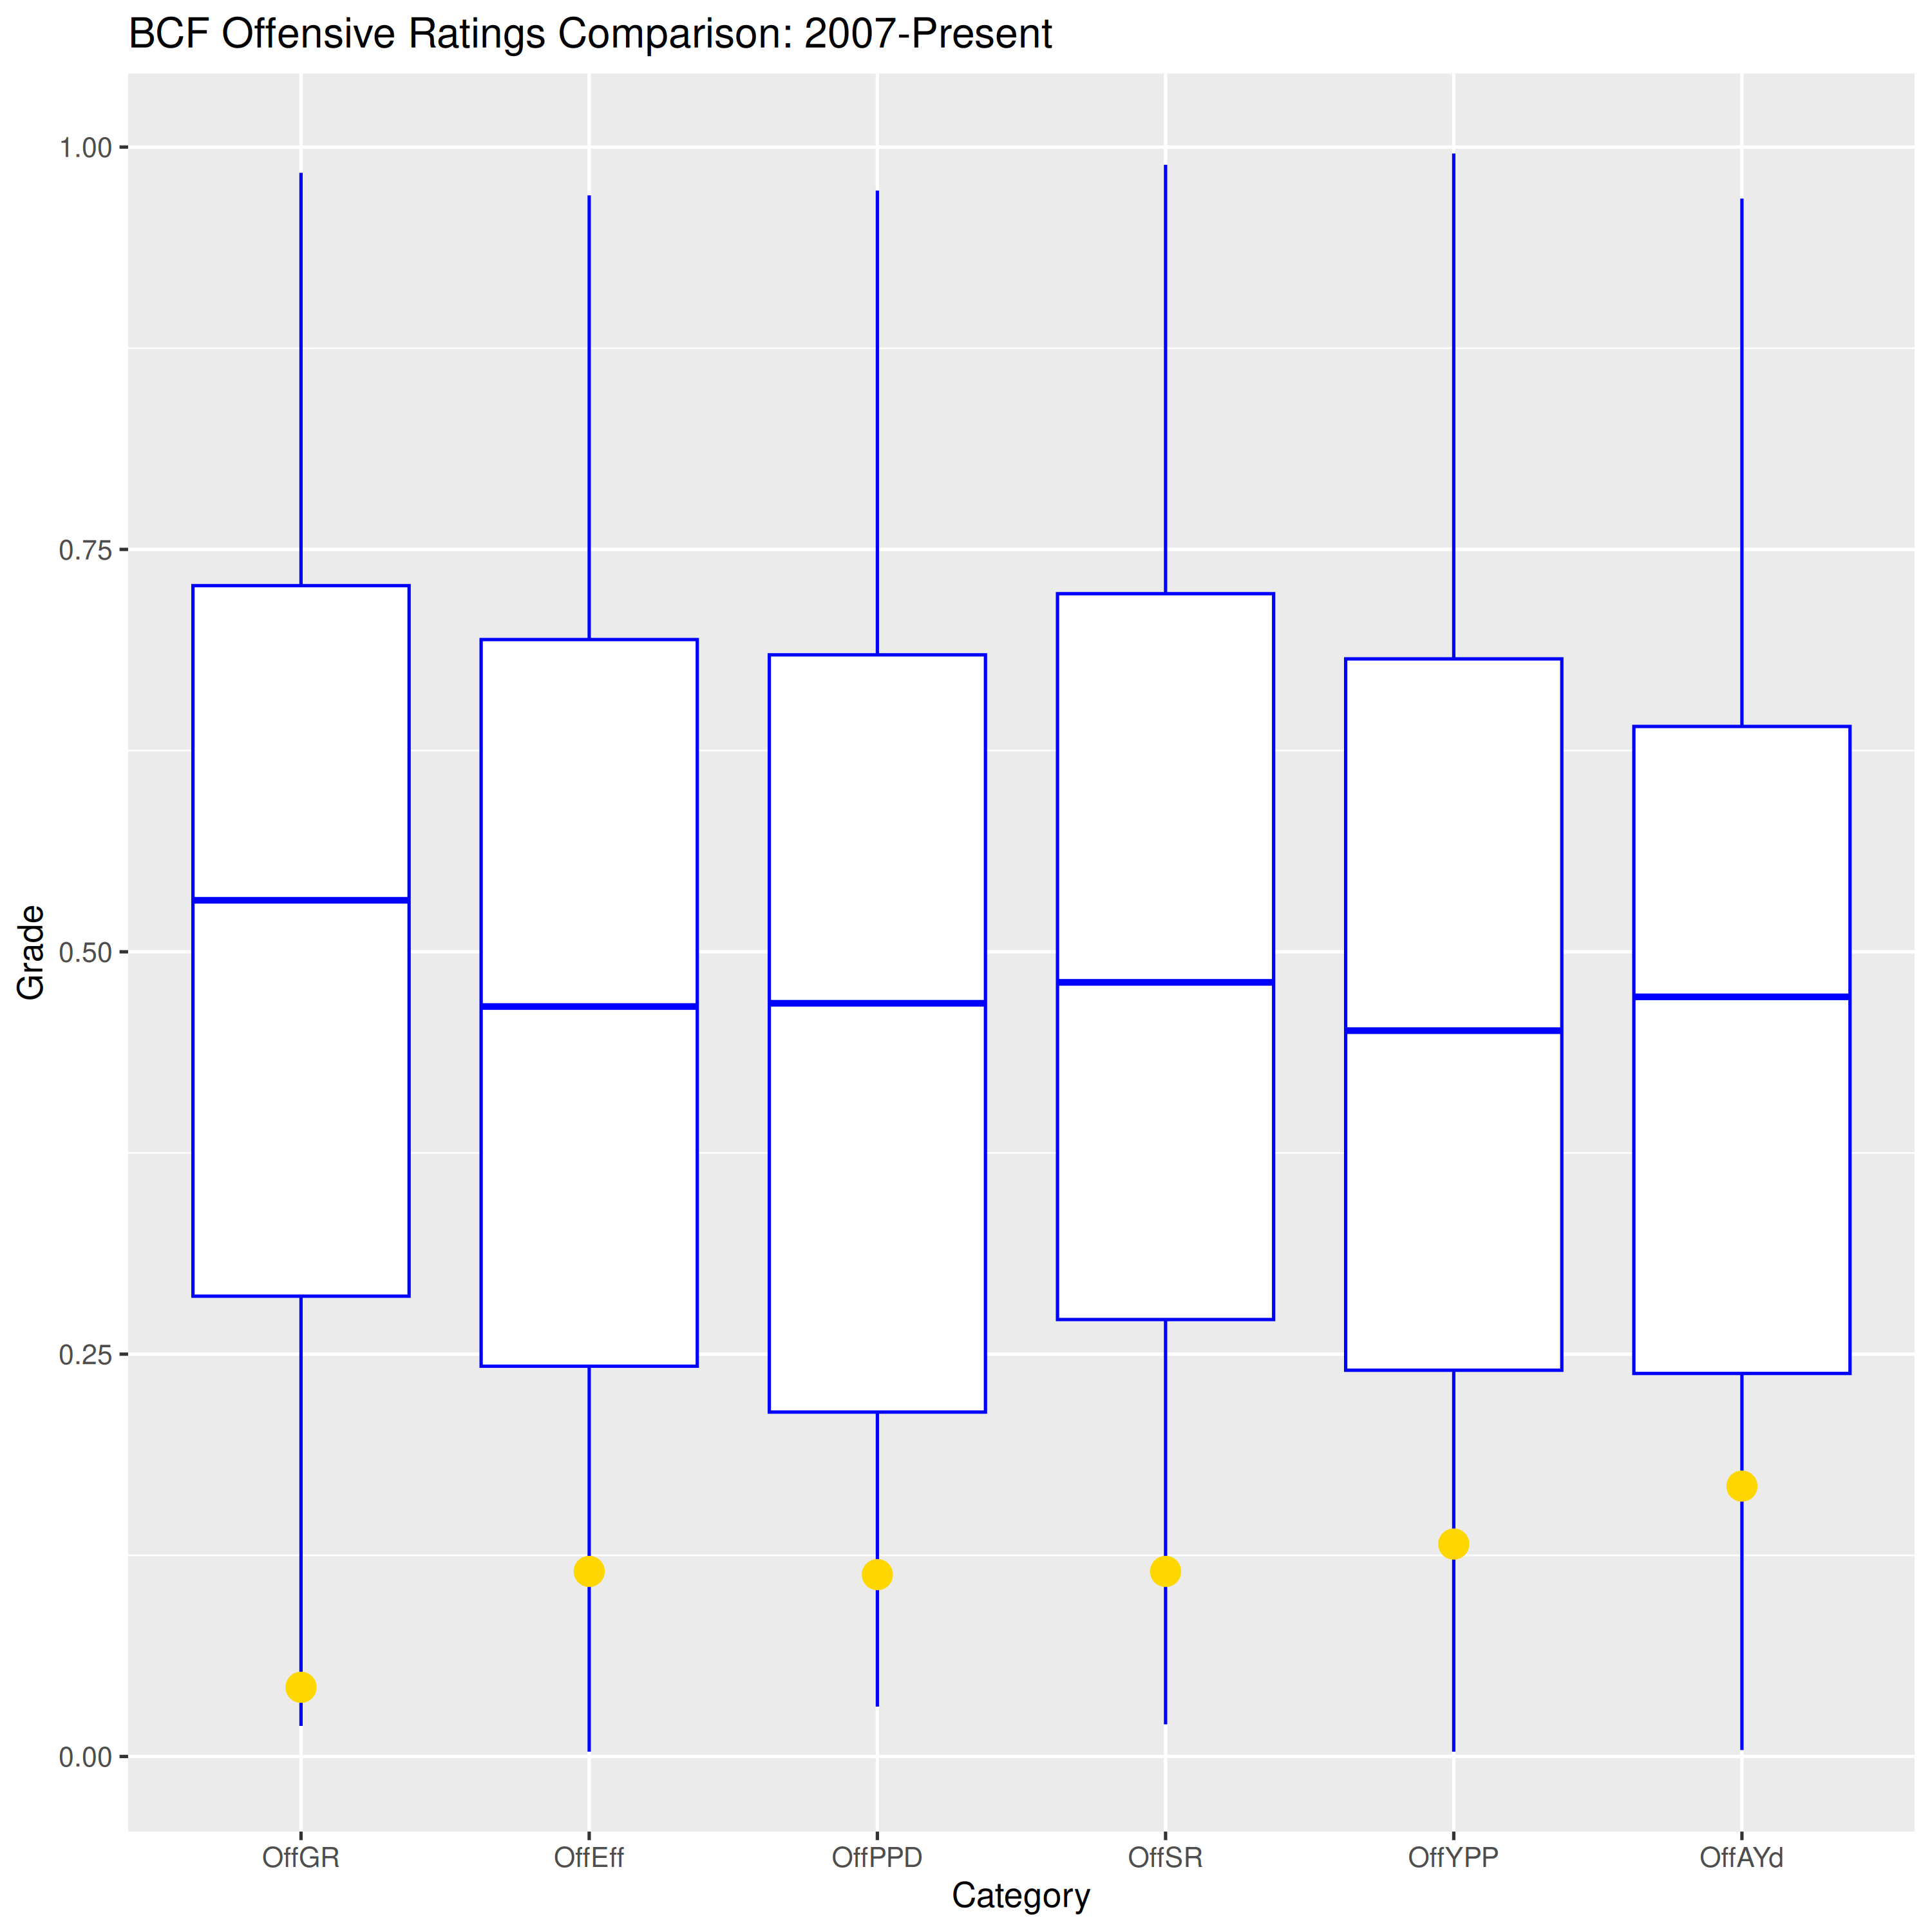
Another offensive performance that’s somewhere around the 10th percentile. Cal could not move the ball on a per play or per drive basis, and they were unable to turn those drives into points. This is the worst kind of plot because there is no depth or nuance to be gained from it (unlike, for example, if Cal had been woefully inefficient but somehow successful at scoring points or vacillating between 3-and-outs and explosive TD drives). Instead, it’s just bad all around.
Defense
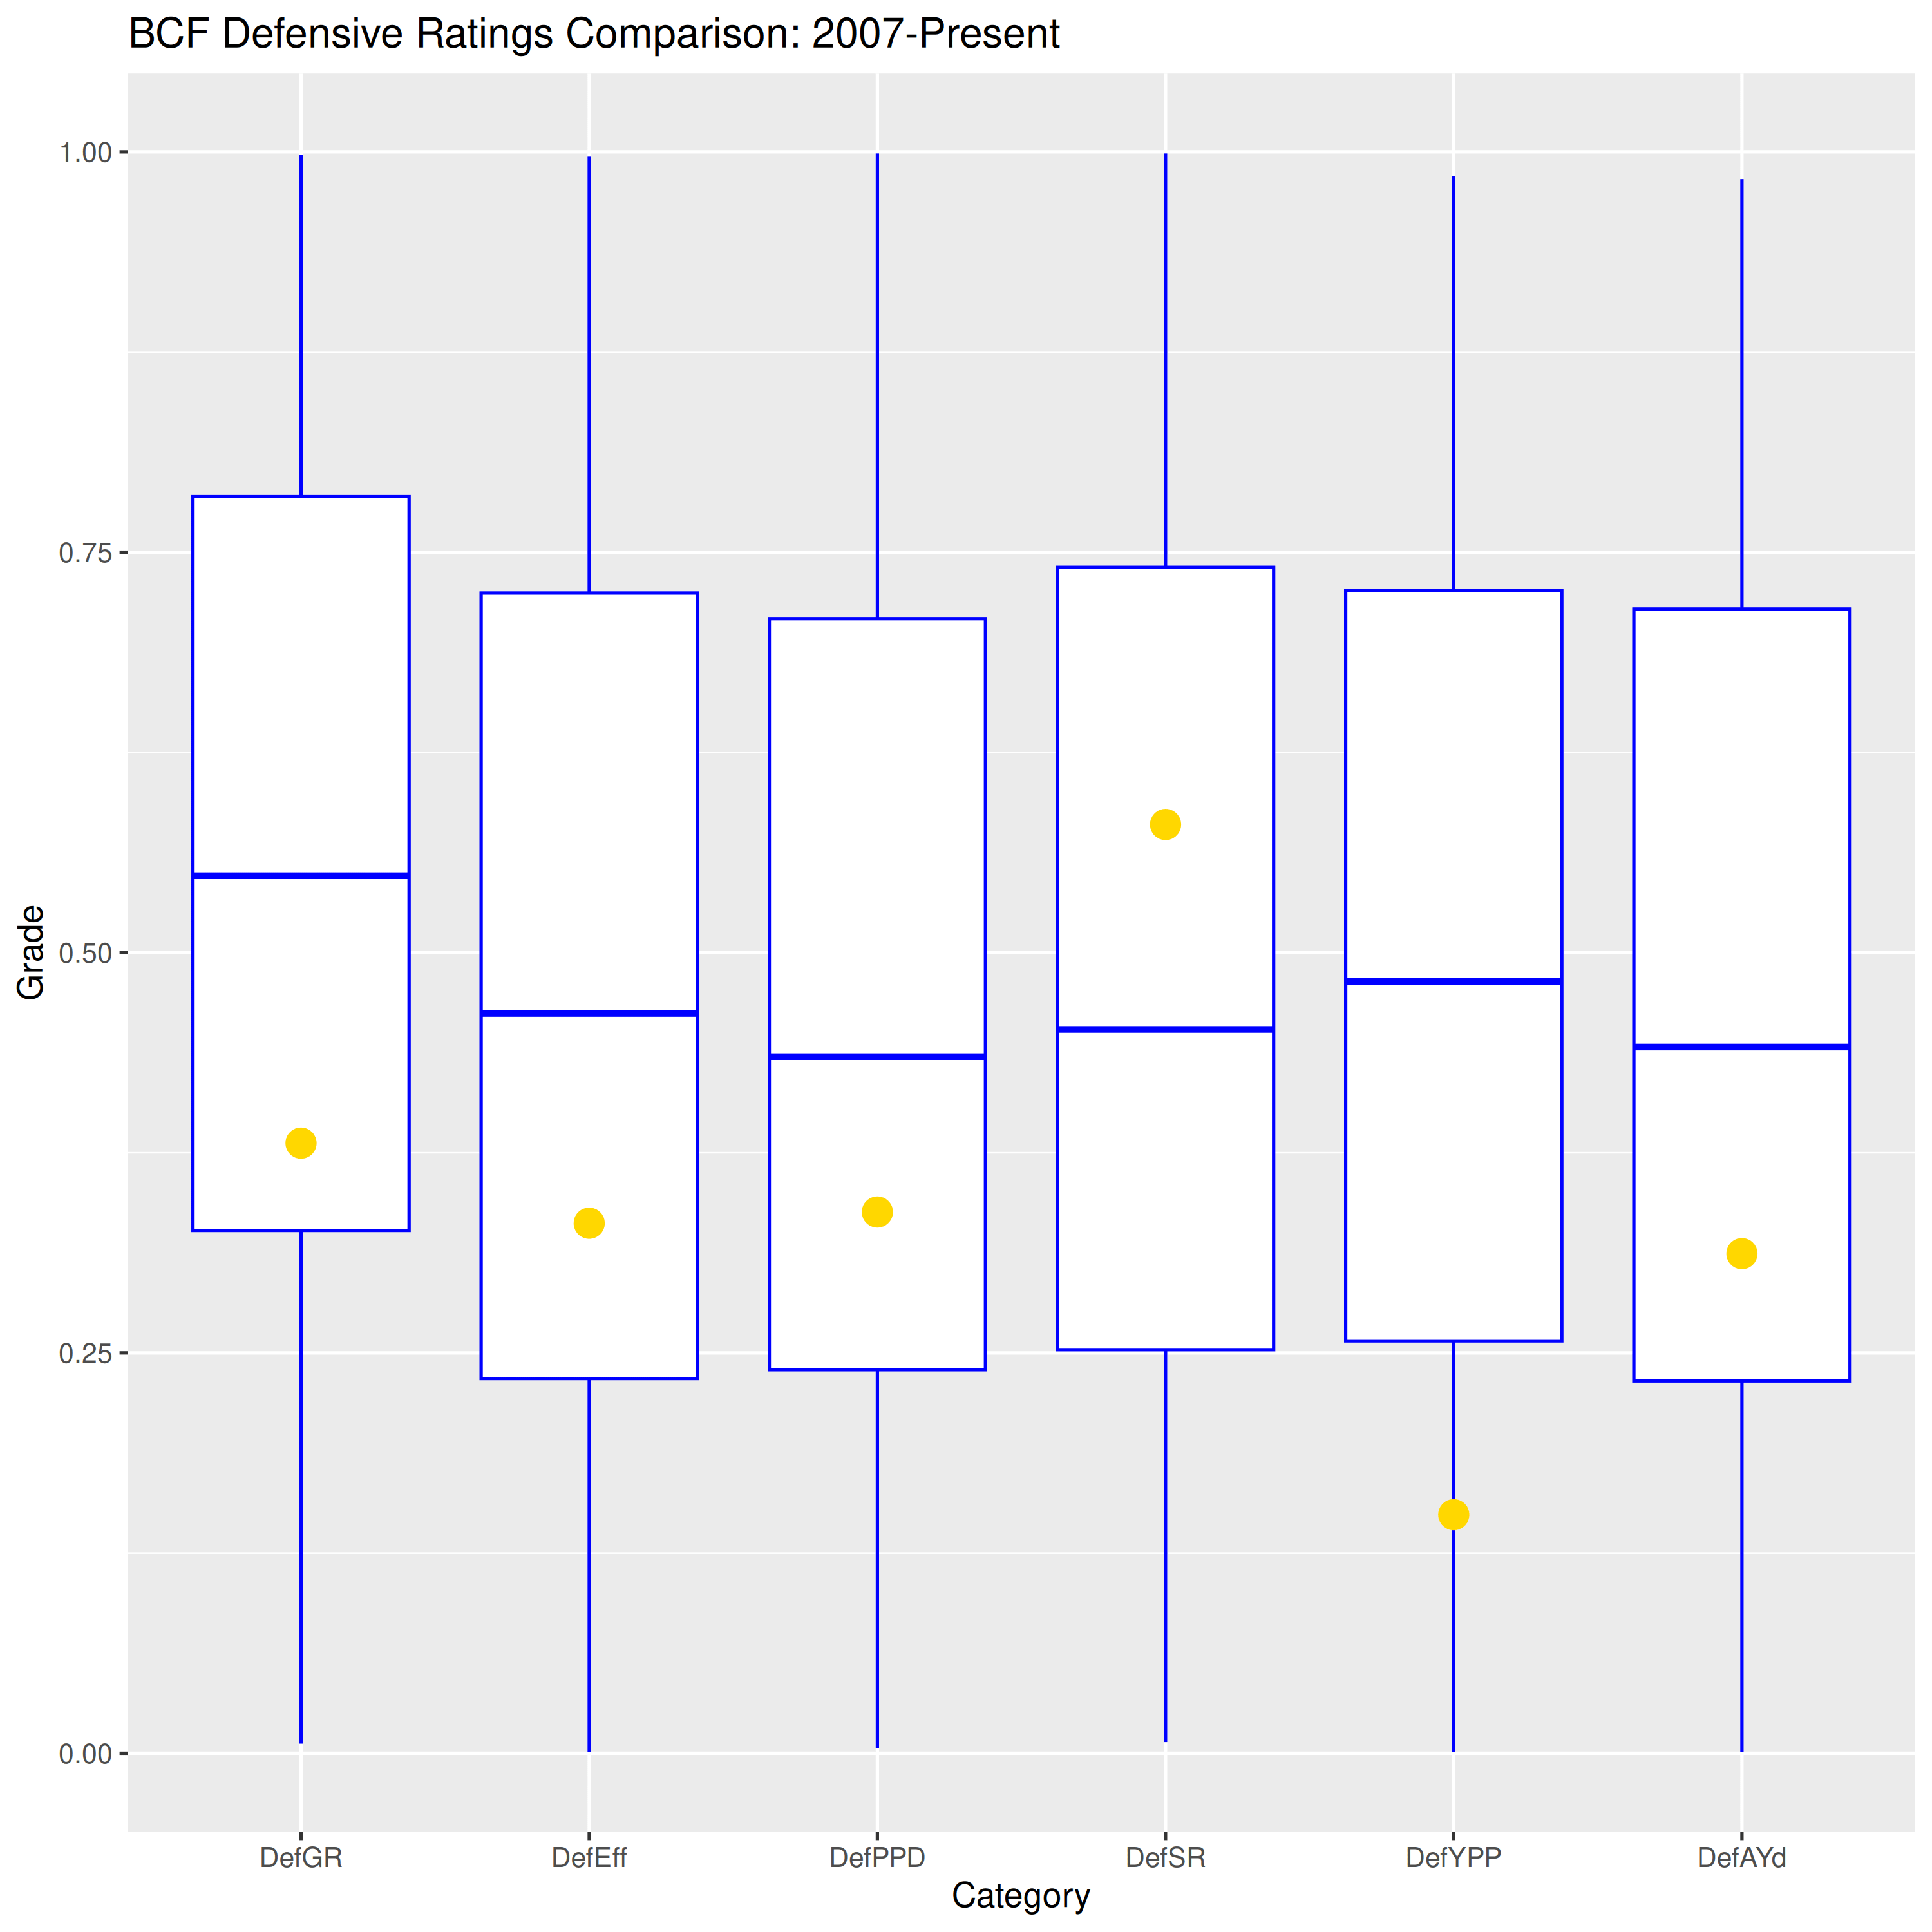
This one is a little more interesting because there is some variety. Cal had a decent first half defensive performance: 6 of NC State’s 8 first-half drives failed to achieve 10 or more yards, and their lone first-half TD resulted from an explosive 49-yard reception. Cal’s defense had a strong Success Rate score, as NC State struggled to get into scoring positions. But that explosive play drove down the defense’s Yards per Play state. And then to open the second half the defense gave up 21 points and 248 yards on NC State’s first three drives. Those drives brought all these ratings down significantly from their first-half levels.
Special Teams
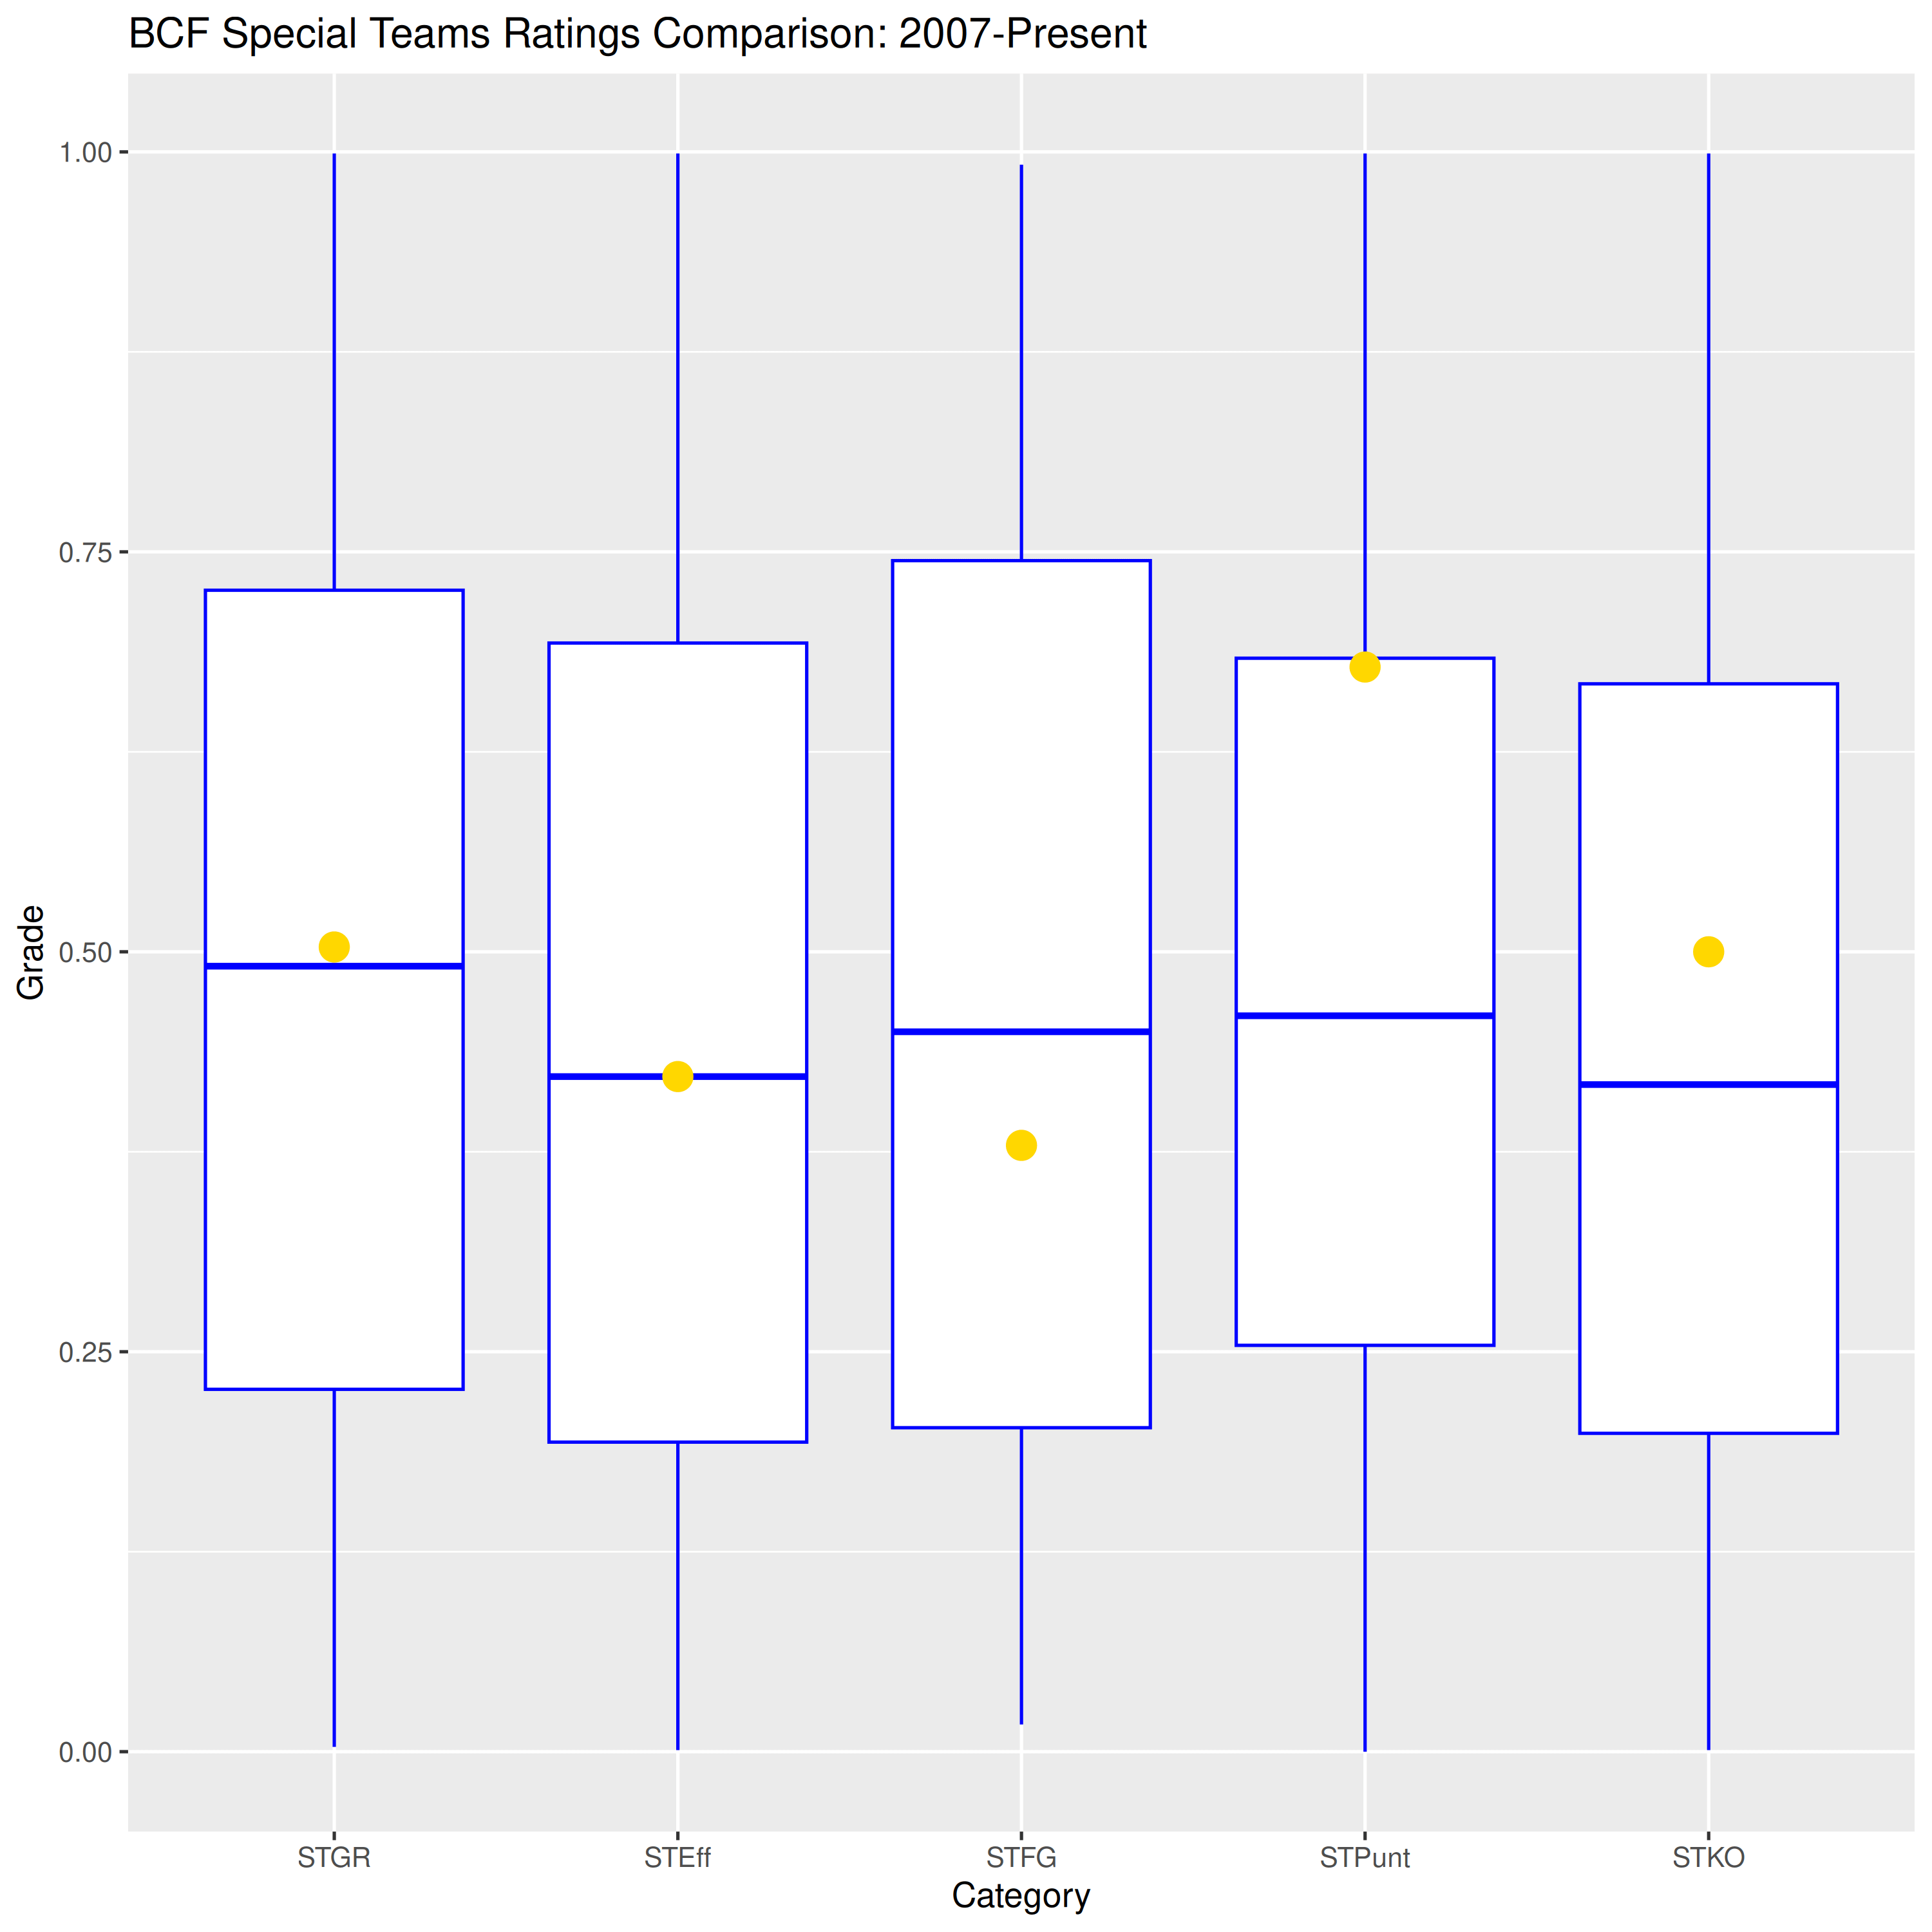
Field Goals were middling thanks to a missed 40-yarder and a made 38-yarder. Averaging 45 yards per attempt on 7 punts, Cal’s decent punting was enhanced by decent coverage and a tendency to get those punts inside the 20. Kickoffs weren’t terrible, which is surprising because Cal returned 3 and none of them were stopped inside the 15 this time.
Cluster Analysis
I already mentioned in the intro that this one fell into The Bad, so there is no suspense here.
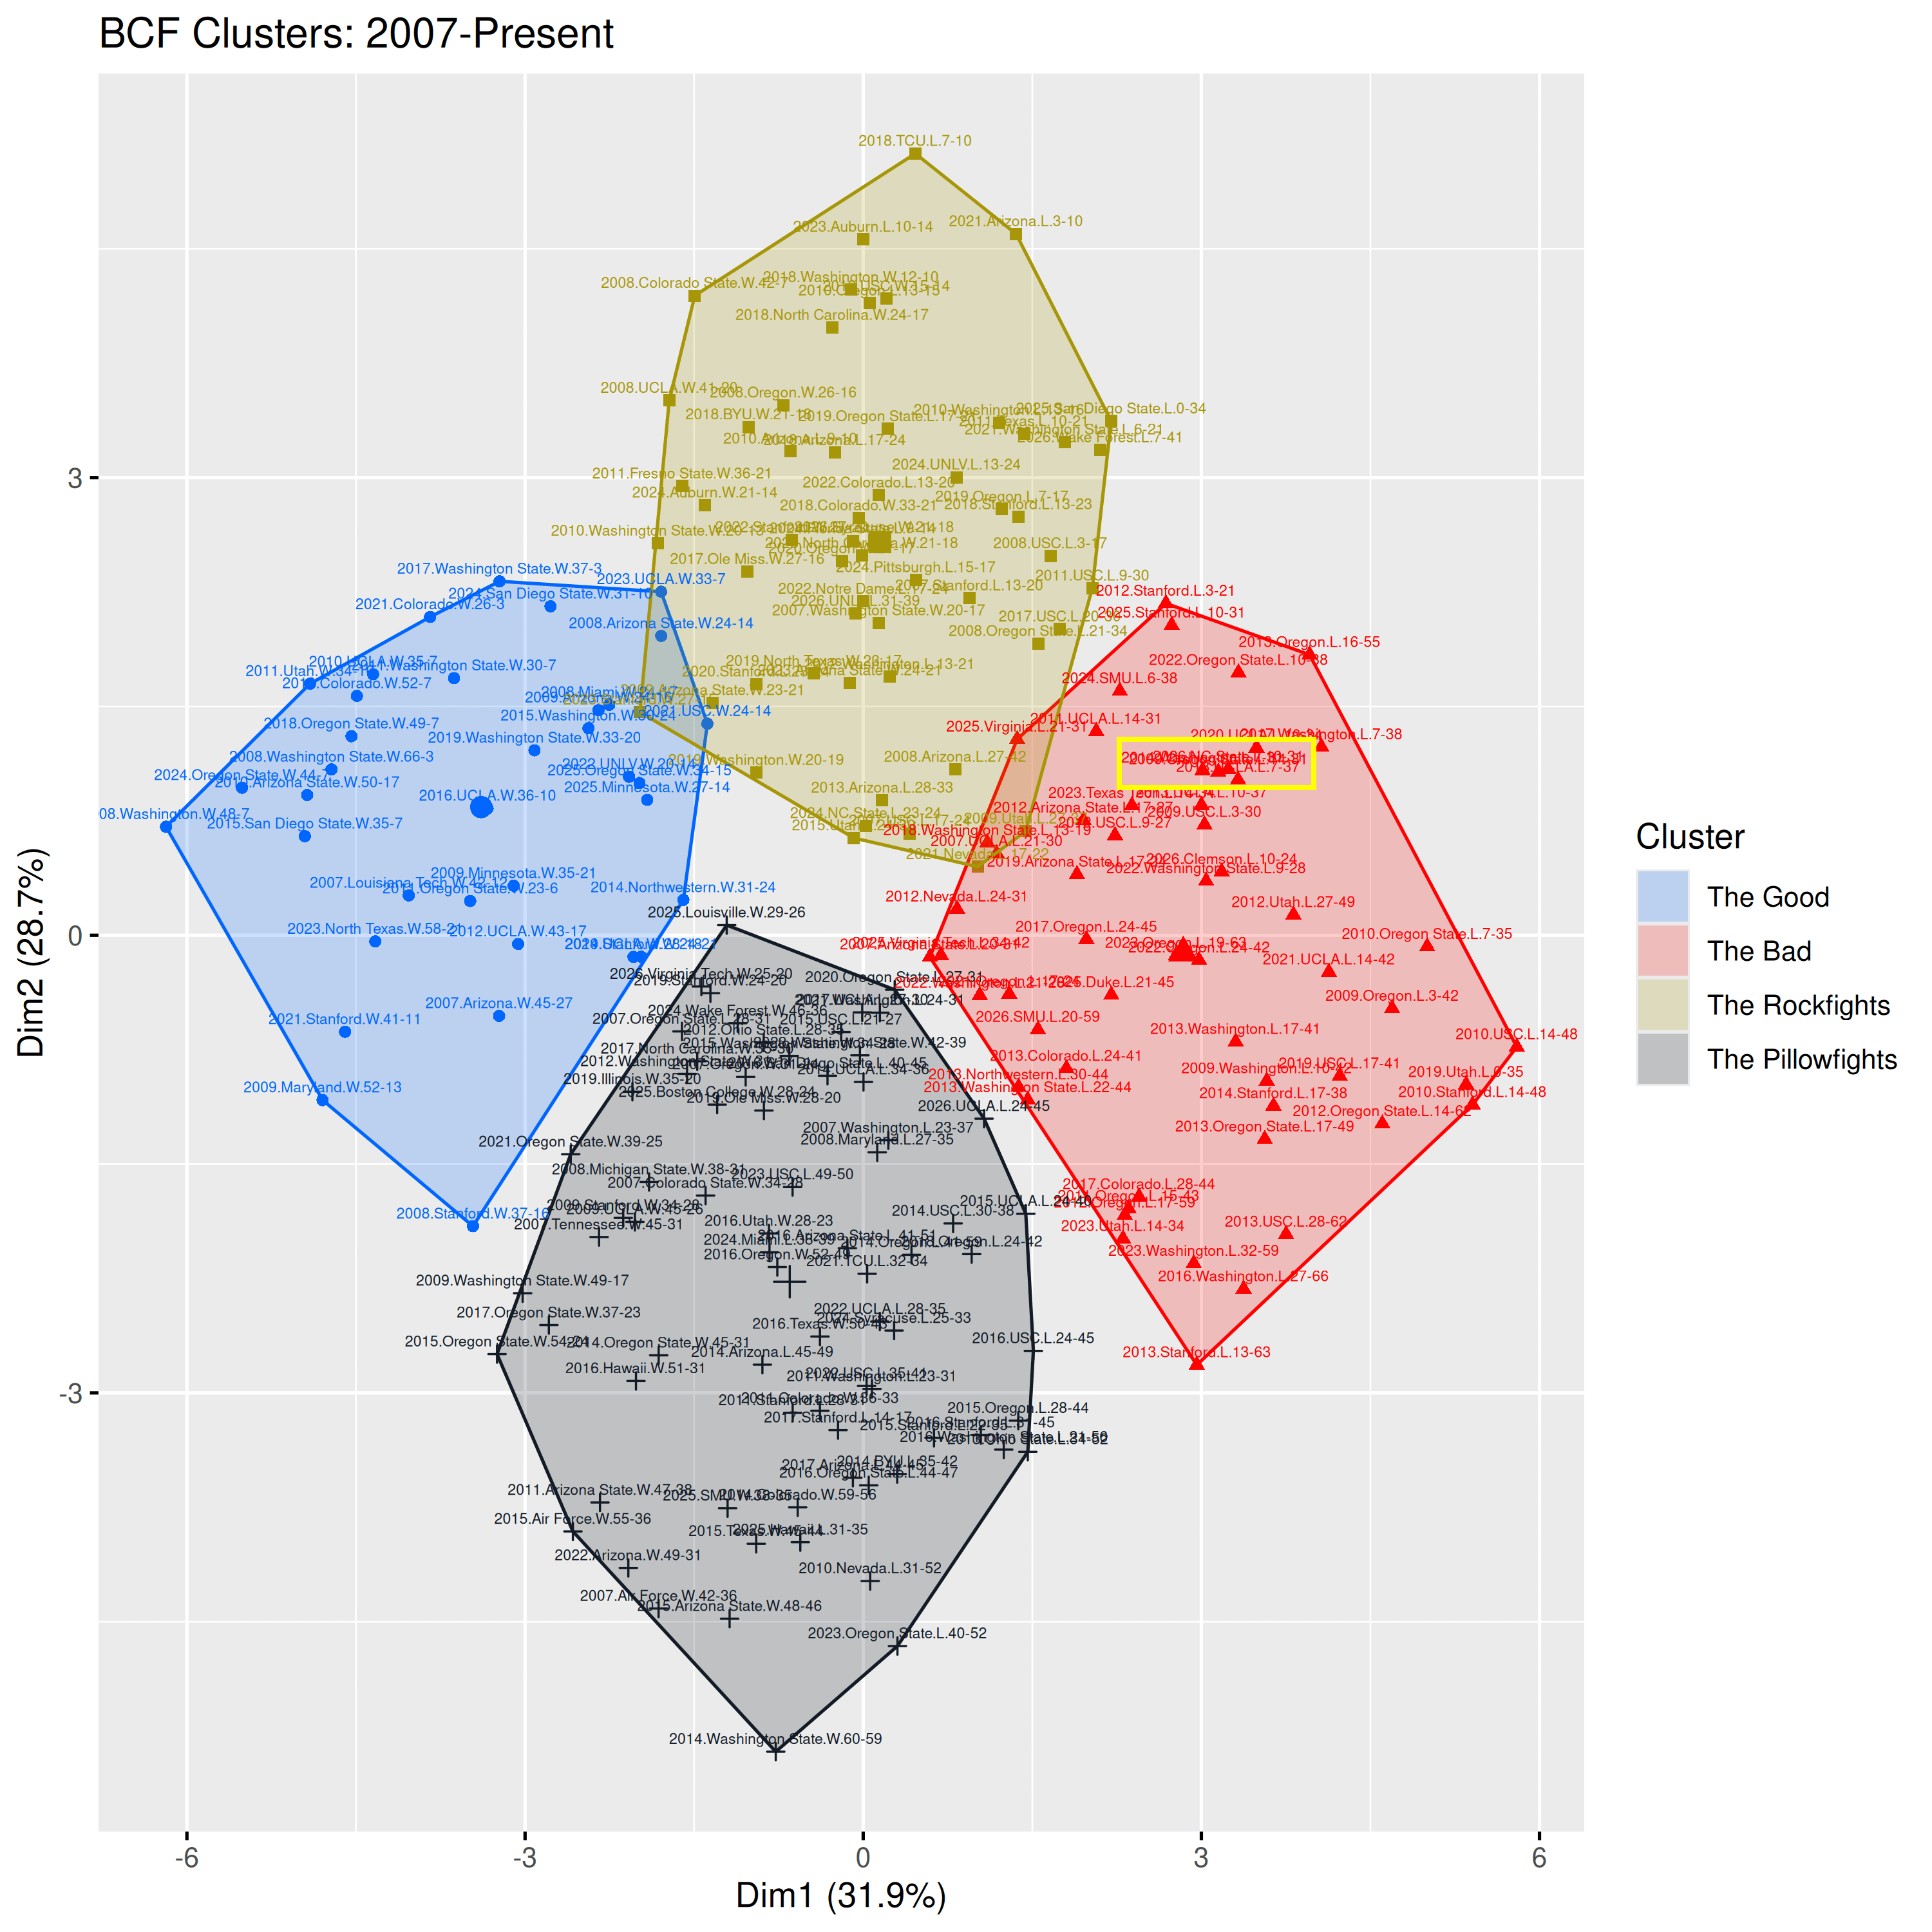
The clustering algorithm finds the most coherent sets of games to include in each category. As a result, we often see games near the periphery of their respective categories jump into an adjacent category when it ends up being a better fit in that new category. Although every game except Virginia Tech has fallen into The Bad during our initial analysis, several of them have since jumped into new categories. UCLA now resides in the Pillowfights; Syracuse and UNLV turned into Rockfights; while Clemson and SMU remain mired in The Bad. With so many games ending up in The Bad, I thought it would be useful to investigate what kind of variation there is in this wretched category.
The Bad, the Worse, and the Dumpster Fires
So I took all the games in The Bad, and ran a cluster analysis on them. The cluster analysis broke those games into three types of Bad:
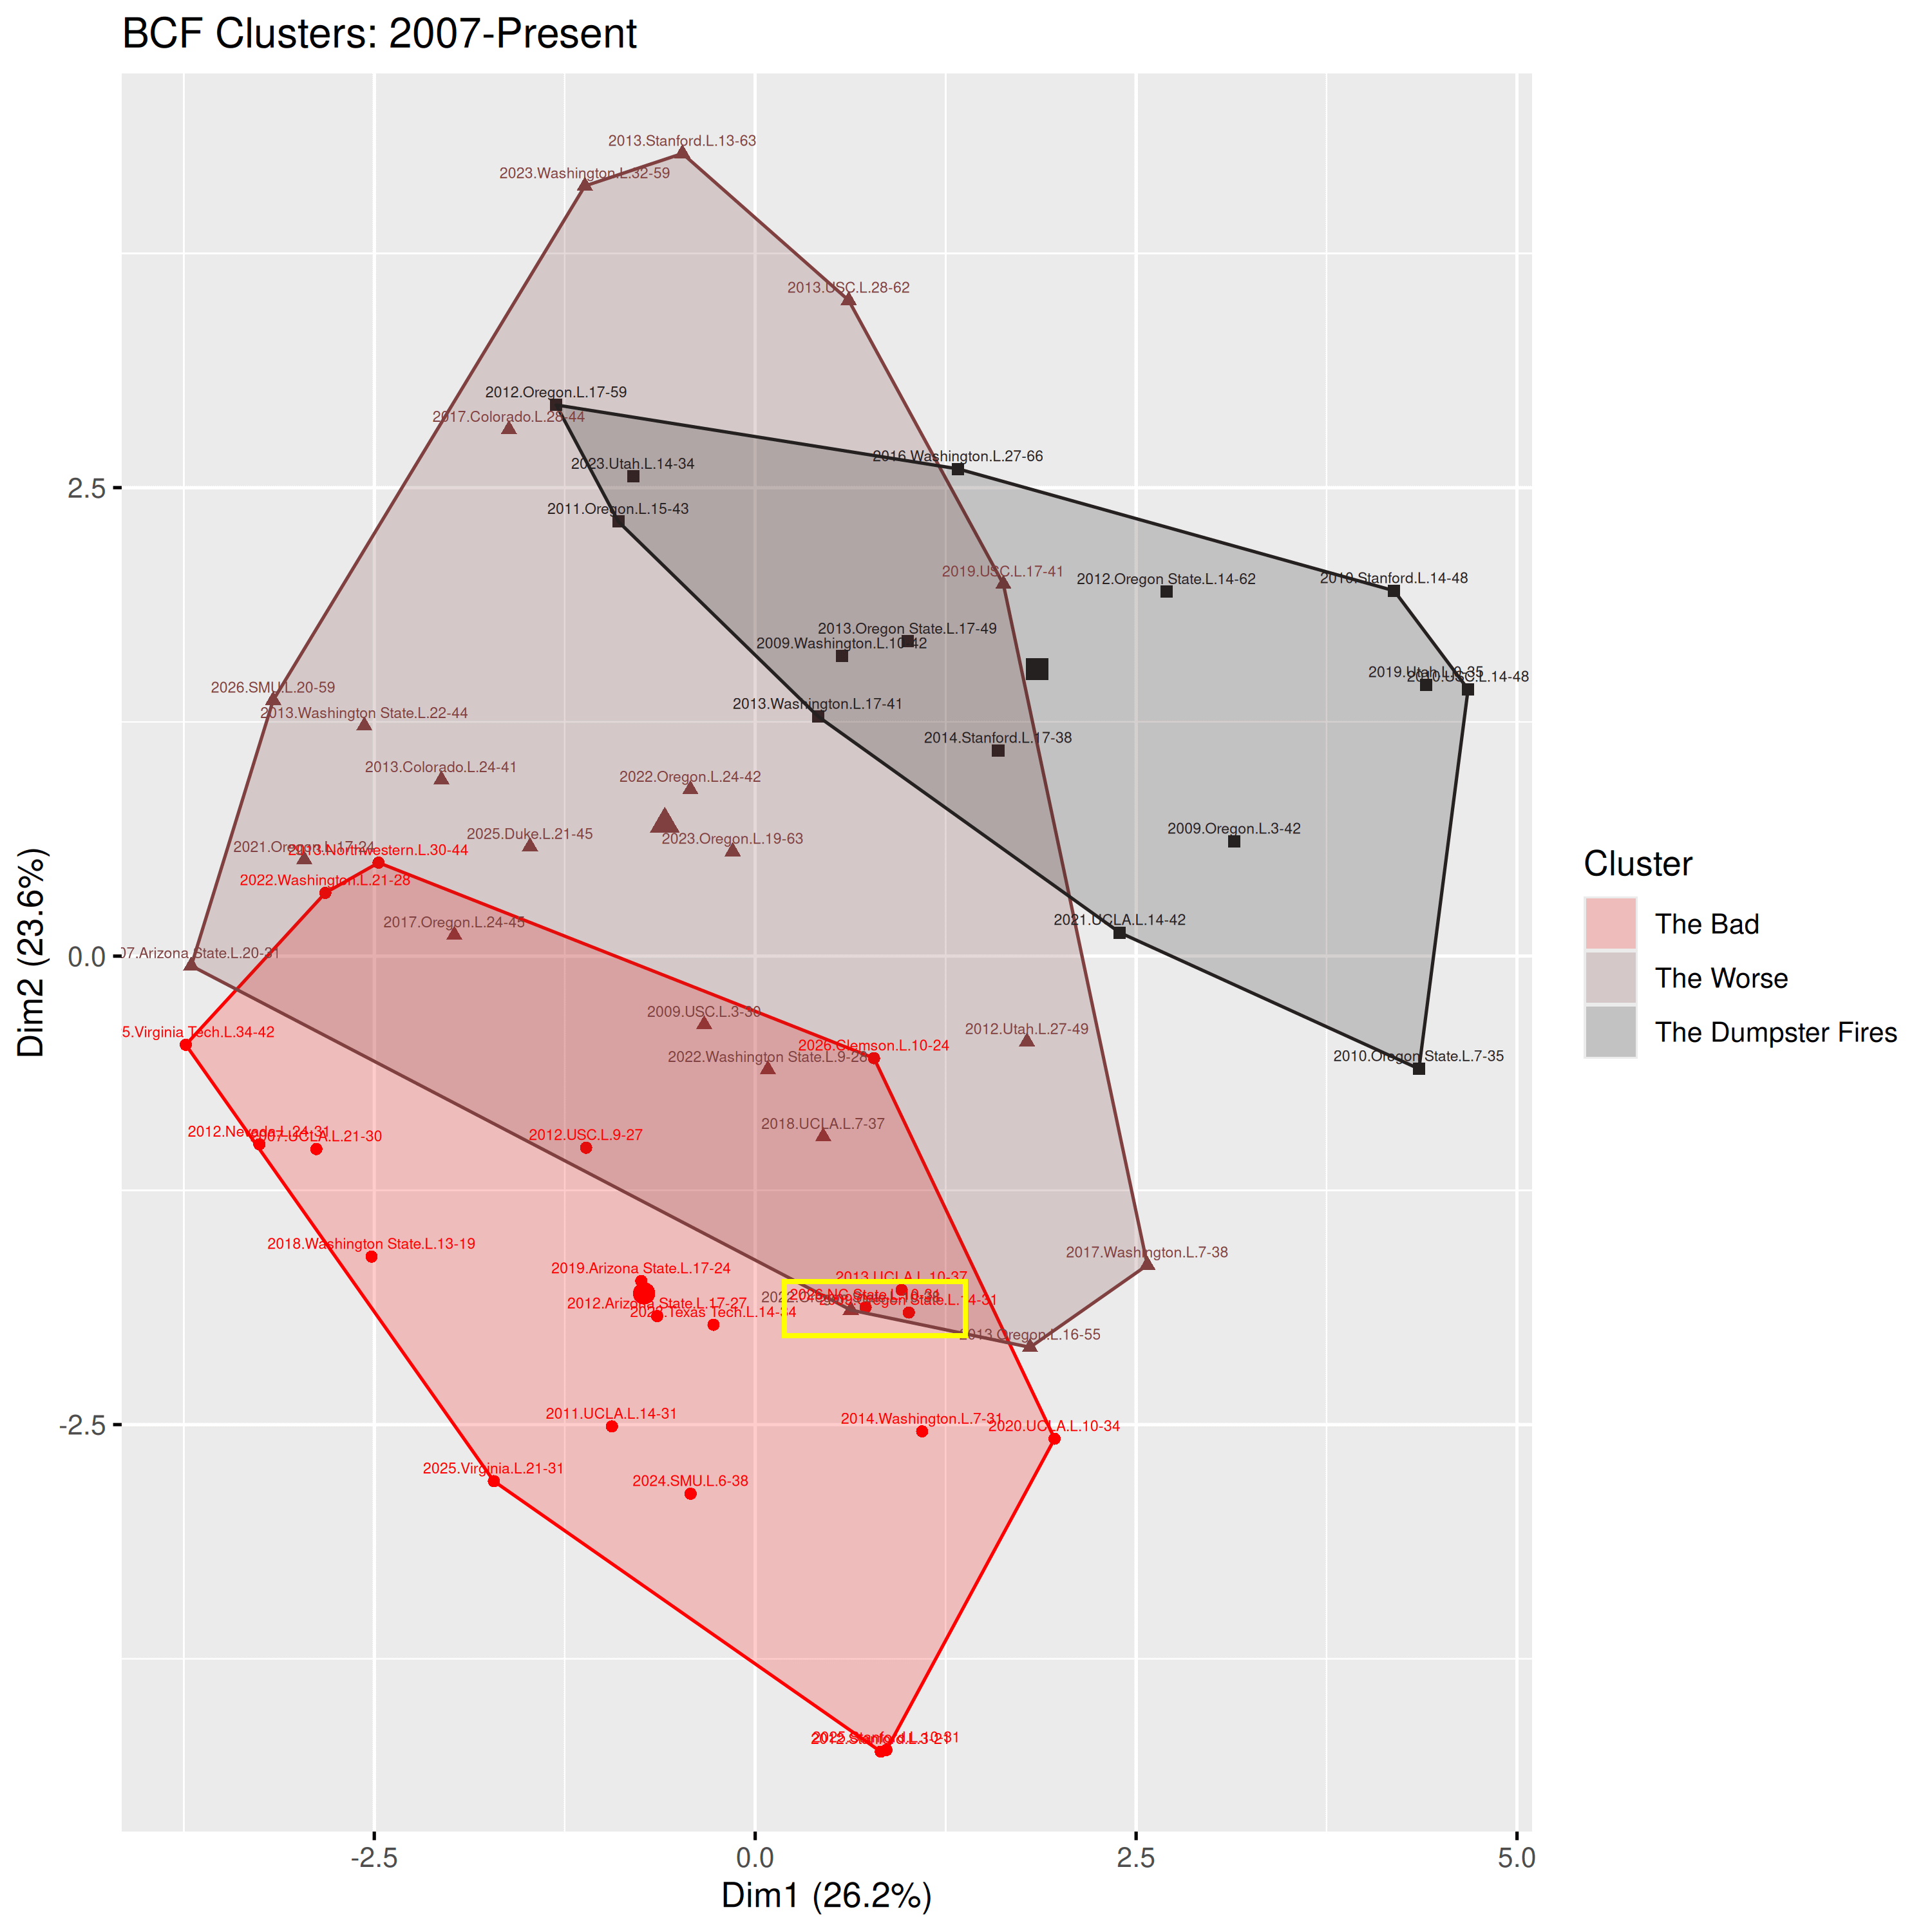
We have three flavors of misery here: entries in The Bad tend to be lower-scoring, with Cal scoring in the 10s or 20s while the opponent usually scores up to 30-something. The NC State game fell into this category, along with several other games where Cal held the opponent in check for part of the game. These games tend to stay close enough to give Cal fans some hope before brutally tearing it away (like Clemson game earlier this year, which also fell in this subcategory). The Worse tend to be higher-scoring entries: Cal scores 20-something points while the opponent scores up to 60, like last week’s SMU game. These games are usually blowouts from the outset, although occasionally they are close for a little while, like that SMU game. Among the worst of the worst, we have The Dumpster Fires, where the opponent easily cruises to 40+ points and spends most of the second half in cruise control, which allows Cal to score a garbage time TD or two.
Deja Vu
I pored through the data to find the game with the closest ratings to this week’s game and…you know what? I’ve hit a wall for how much bad football I can analyze in one day. I think we’ll end this one here without rehashing yet another miserable Cal loss (by the way, the closest match was the 6-38 loss to SMU in 2024). Enjoy the bye week, Cal fans. Go outside, breathe the fresh air, and do something you really enjoy. We all deserve a weekend off from Cal football.
This is a reflection on the coaching. Clemson, UCLA, SMU, NCSU were lost in the 2nd half with bad D and an O that just completely turtled. As one power rating column observed this week, "The Cal experiment in the ACC has been a failure". PLEASE, PLEASE, PLEASE for 2027 invest NIL $ in the OL and DL after the upcoming portal tsunami. I'd rather have Rockfights and go 6-6, than this dumpster fire of a program.