


Welcome back to our weekly exercise in using the previous game’s data to fit Cal’s performance into one of four buckets. This series is ideal for trying to characterize the team under a new coaching regime, as it takes loads of performance data and distills it into one choice among several simple categories. The team’s performance profile has been quite consistent, as this week marks the fourth consecutive week we have seen the same resulting classification. For better or for worse (mostly for worse, given the results), we have strong, consistent signals of what kind of team the Lupoi Era has fielded, and it’s not a good result.
Ratings Comparison
Our friends at BCF Toys used FEI’s drive data to evaluate how well the offense moves and scores the ball, how well the defense stops the ball and keeps the opponent from scoring, and how much special teams contribute to Cal’s scoring.
Offense
As usual, we illustrate the ratings with boxplots. The gold dot represents Saturday’s ratings, the box captures data between the 25th and 75th percentiles, and the horizontal line represents the midpoint of the data. Above the line is good, above the box is great, and the opposite is true for results below the midpoint.
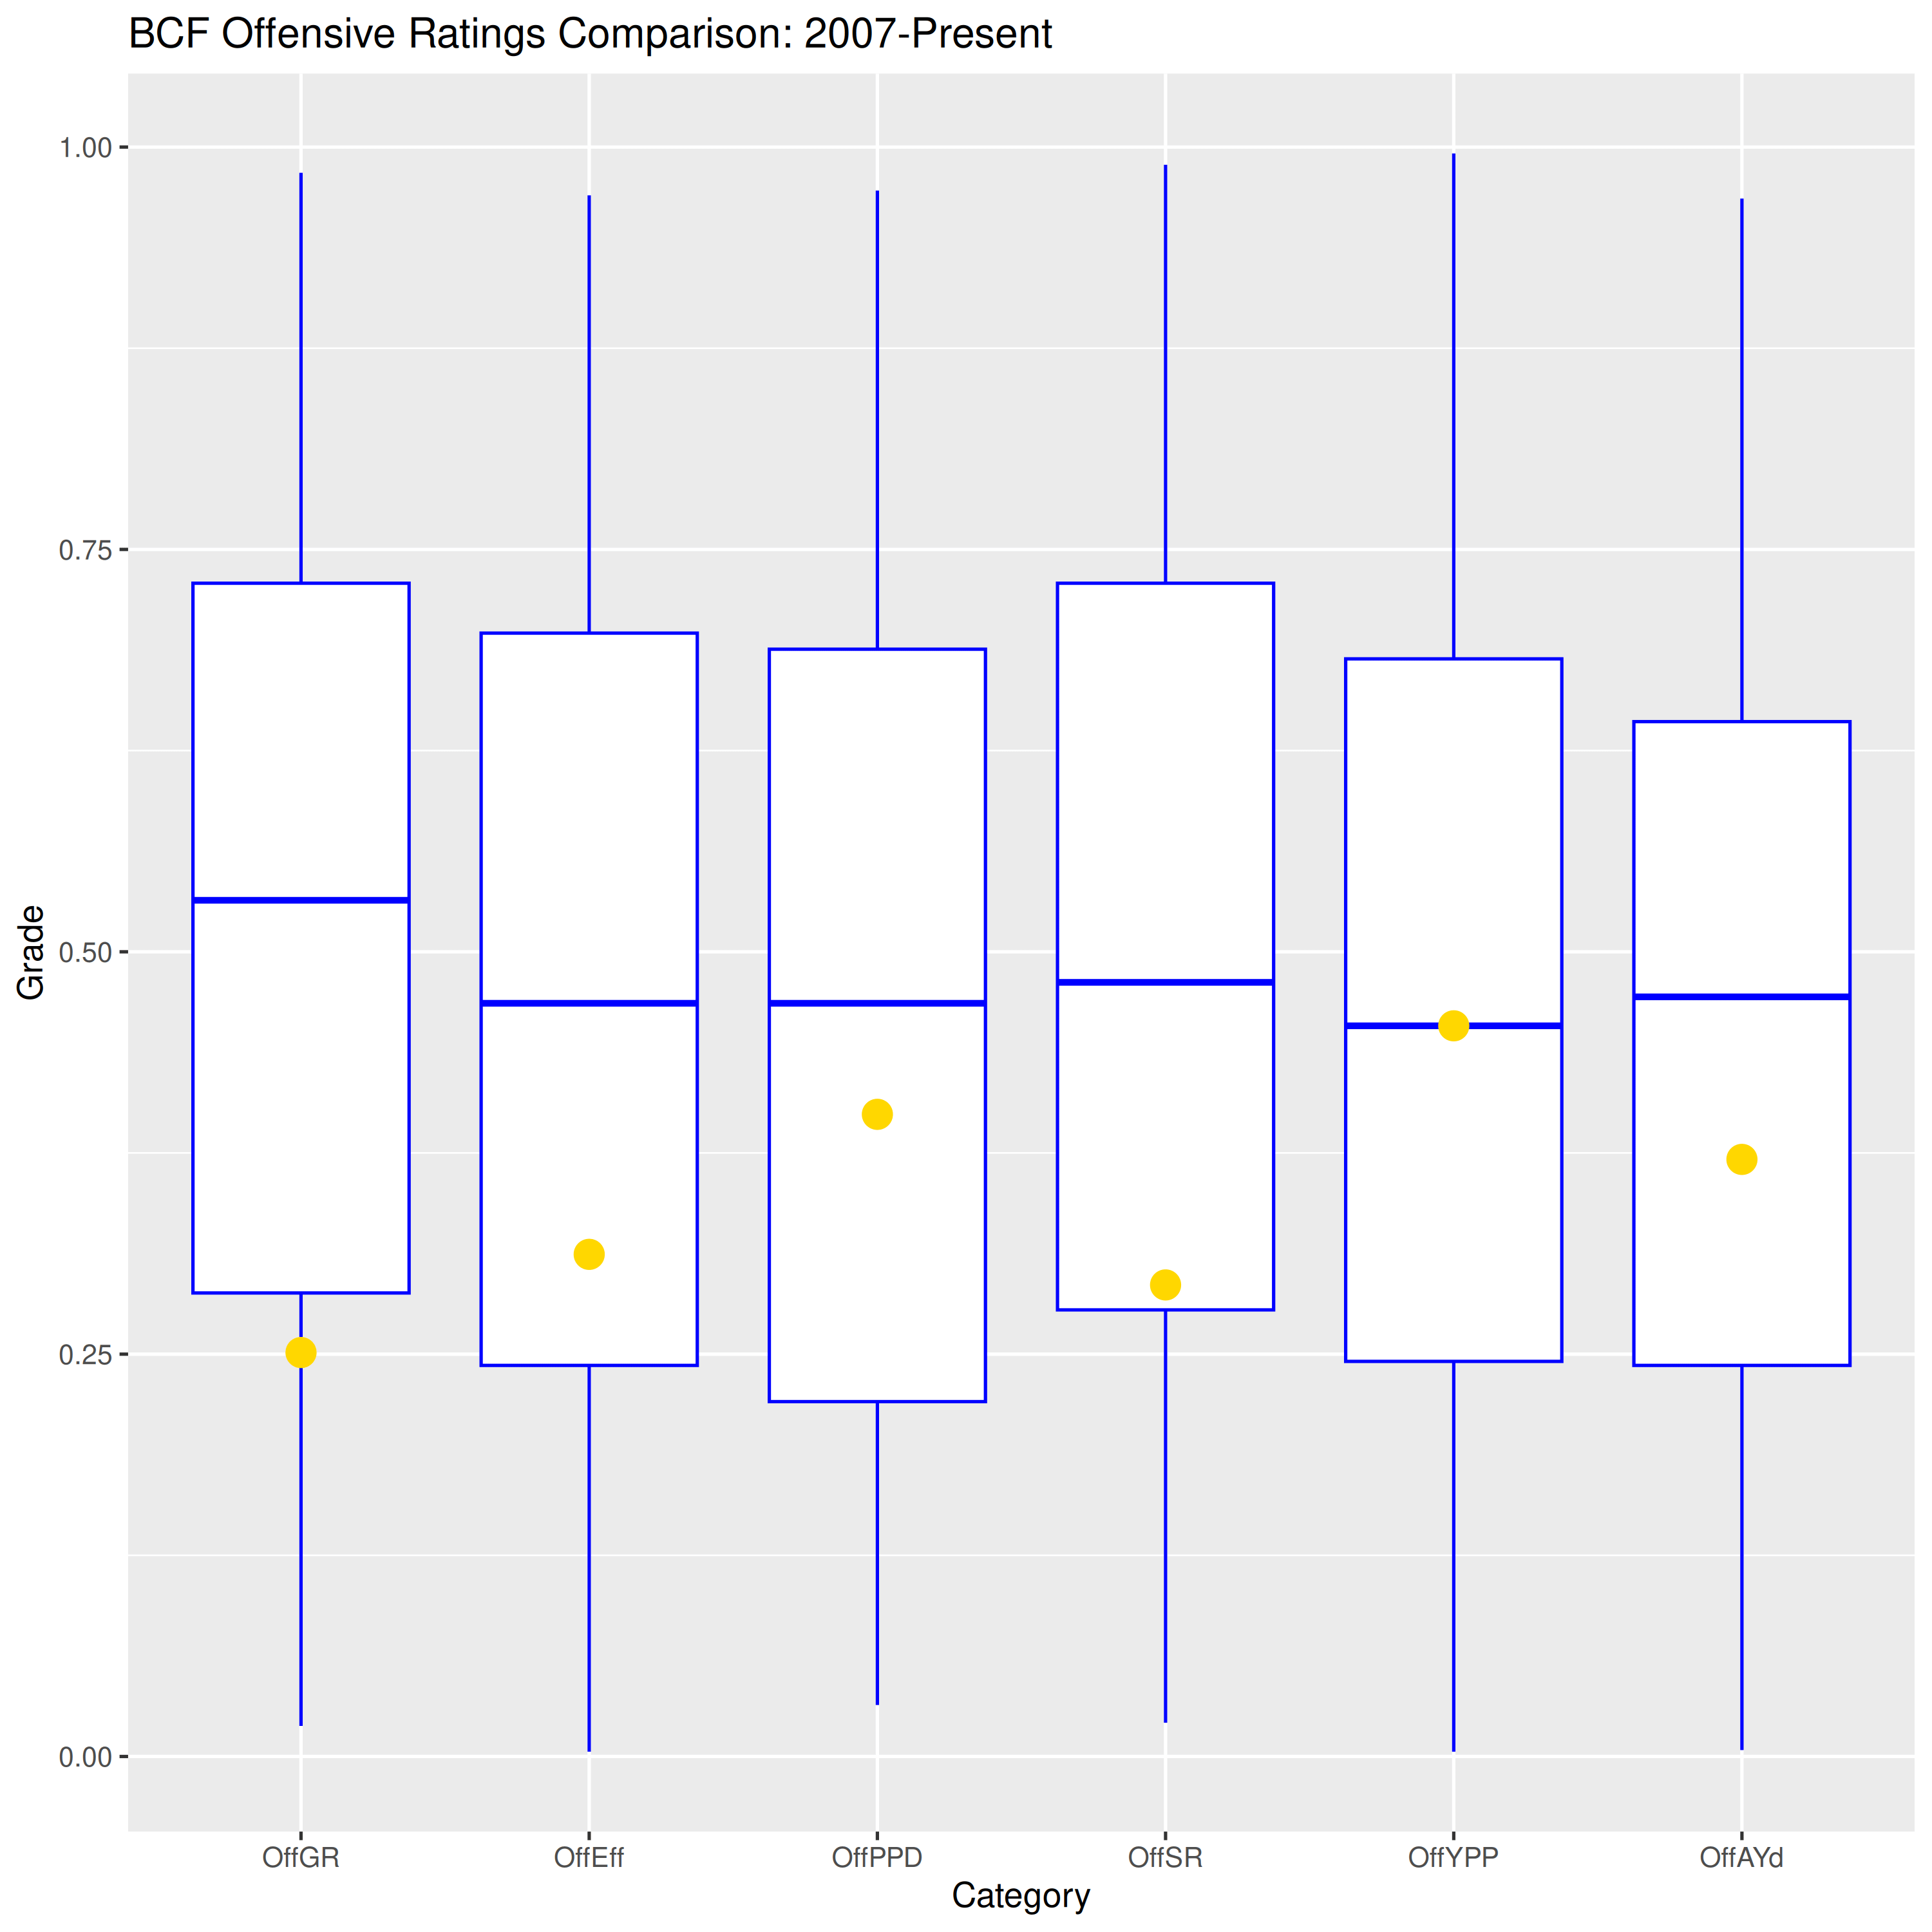
Efficiency was bad, indicating that Cal was ineffective at turning possessions into points. The Game Rating adjusts that Efficiency rating for opponent quality, so this performance was even worse when accounting for UNLV’s 68th-ranked defense. Points per drive was not bad, as Cal tended to convert its scores into touchdowns. However, the ability to get into scoring position, as measured by Scoring Rate, was quite poor. Yards per Play was perfectly middling while the ability to cover the yards needed to score, measured by Available Yards, was sub-par. We have so many ways to measure offensive performance, and they’re nearly all bad. Pain.
Defense
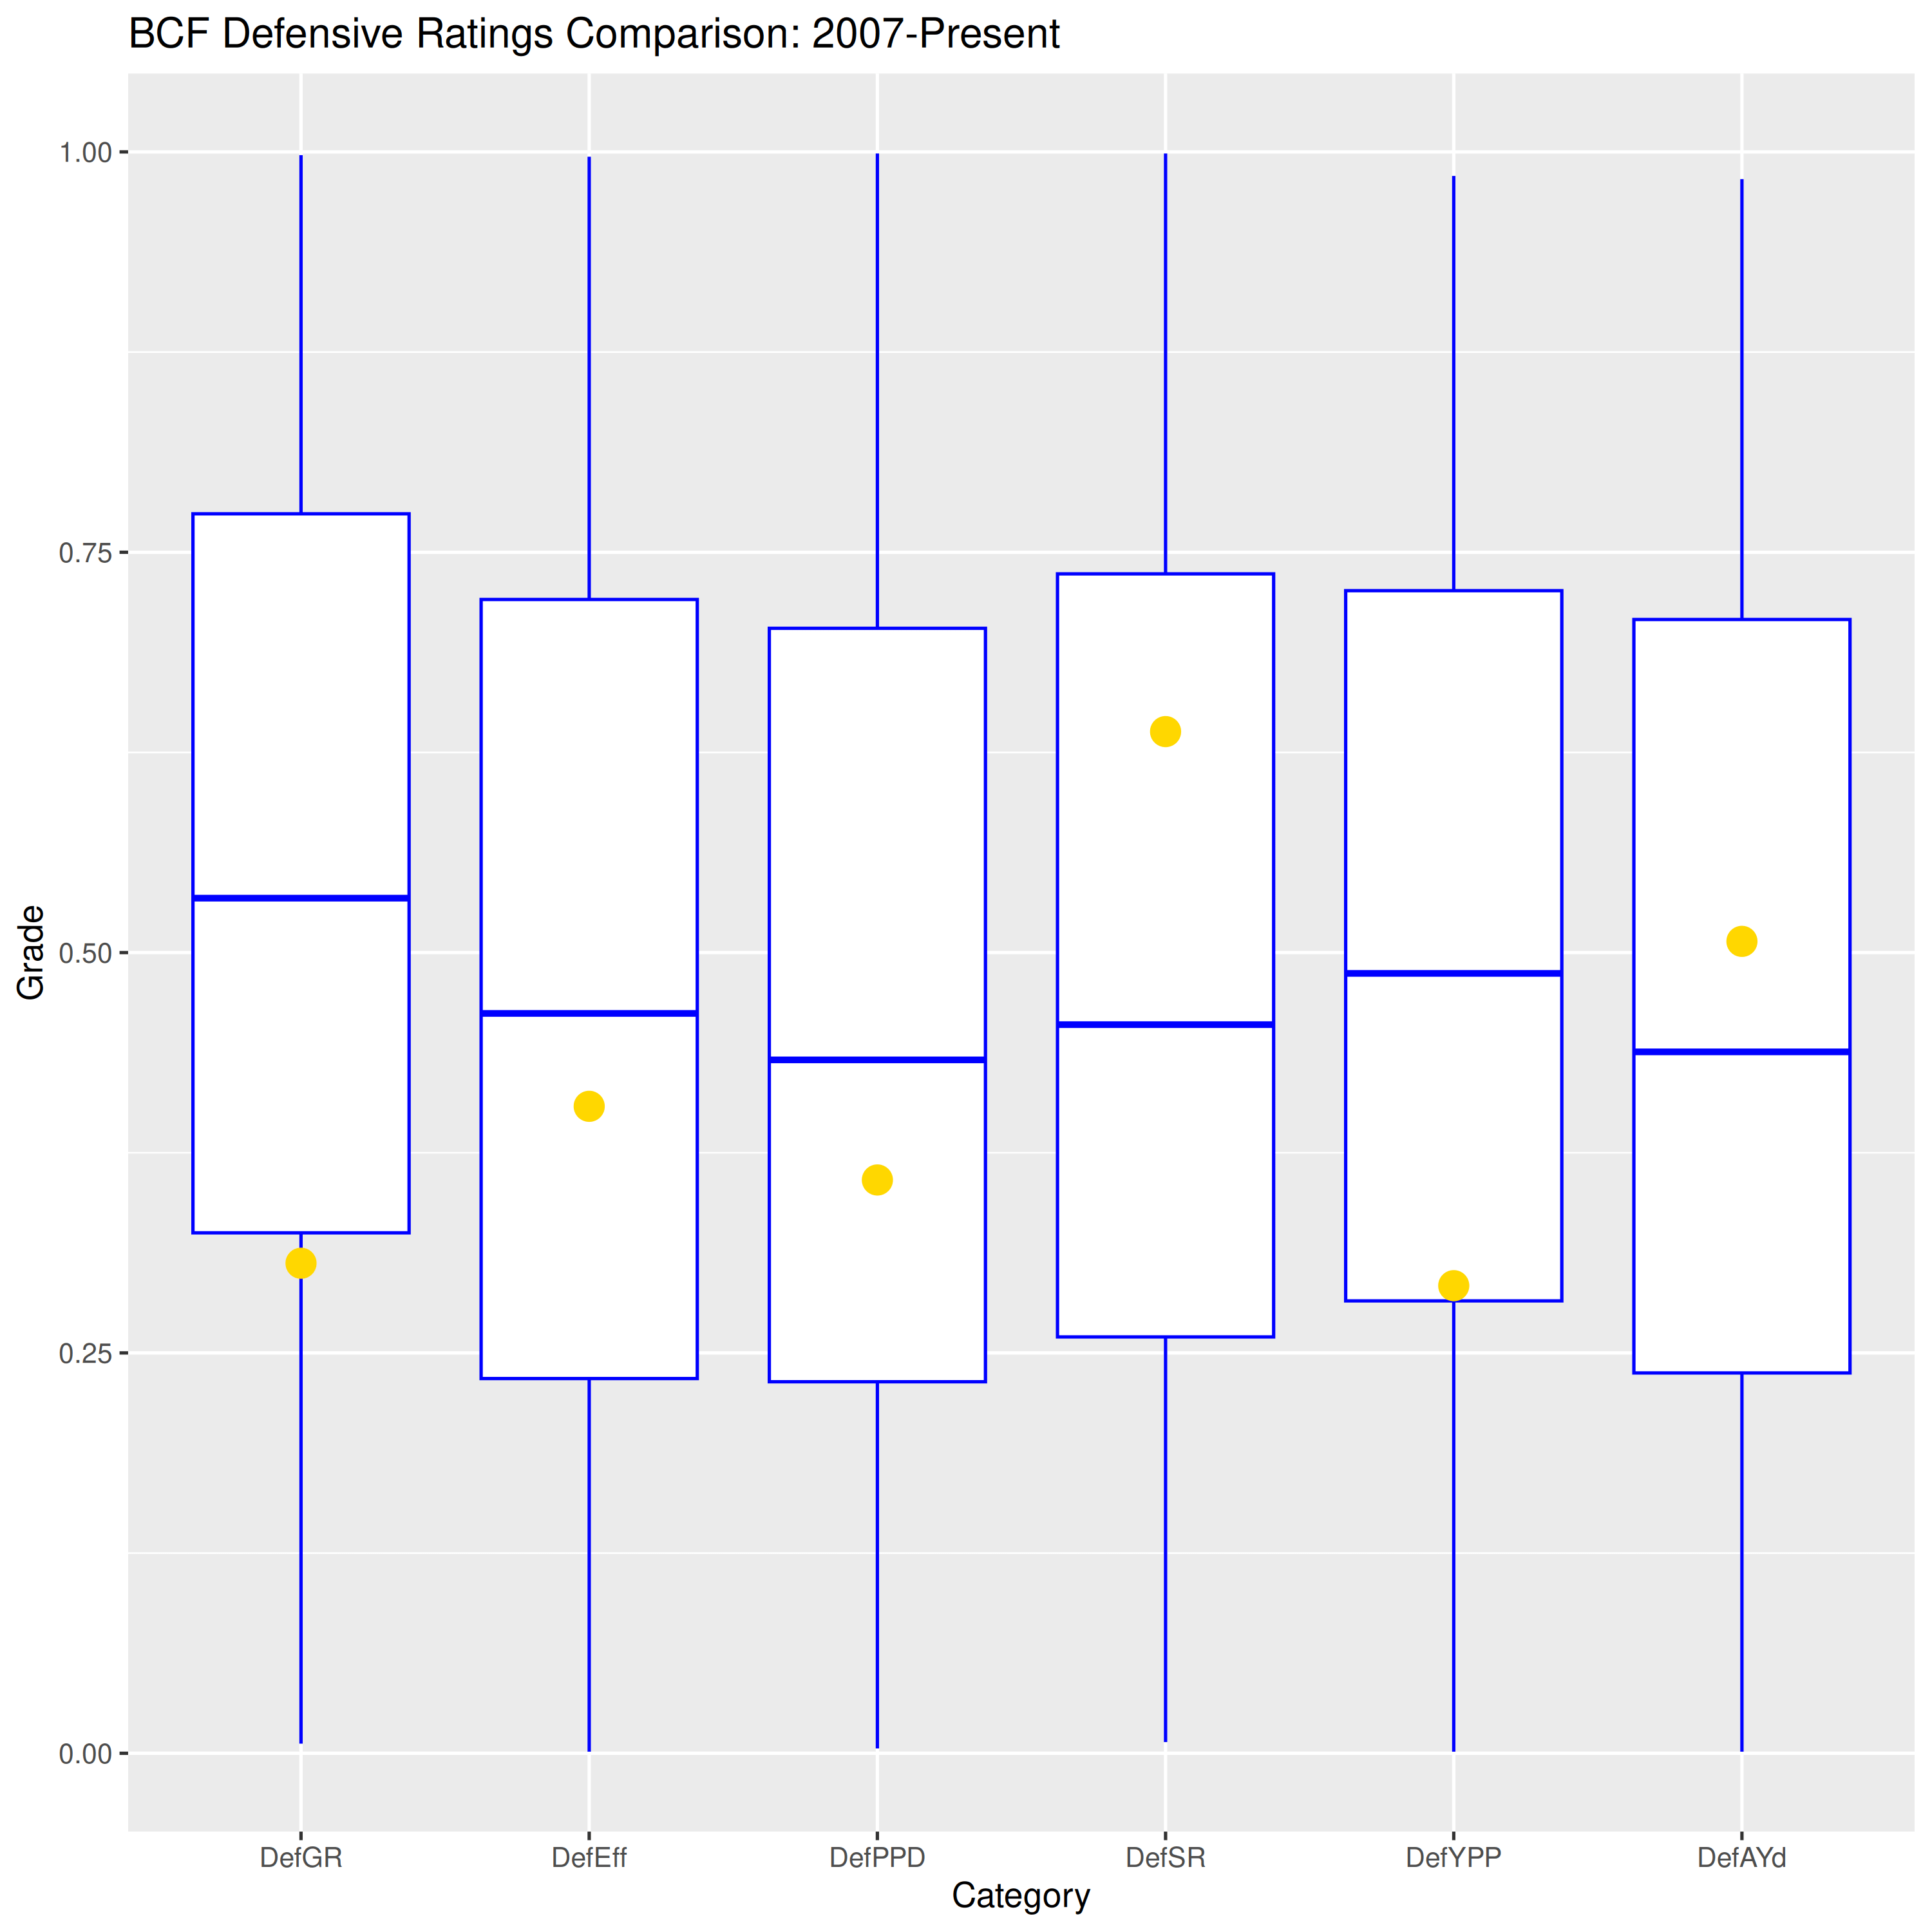
Defensively, this is a weird profile. Cal’s defense had several strong drives but they also surrendered several explosive plays. Defensive Efficiency was slightly worse than usual, although that Game Rating takes a dive when accounting for UNLV’s 87th-ranked offense. Points per Drive was slightly worse than usual thanks to UNLV’s ability to turn its drives into TDs rather than field goals; but it took them 14 drives to accumulate those 6 scoring attempts, so the defense’s Scoring Rate is decent. The Available Yards measure indicates that Cal did a good job of stalling UNLV’s drives, although the poor Yards per Play reflects those numerous, explosive plays the defense gave up. When things went badly, they went catastrophically badly. Overall, it was a weird game that averaged out to somewhat sub-par.
Special Teams
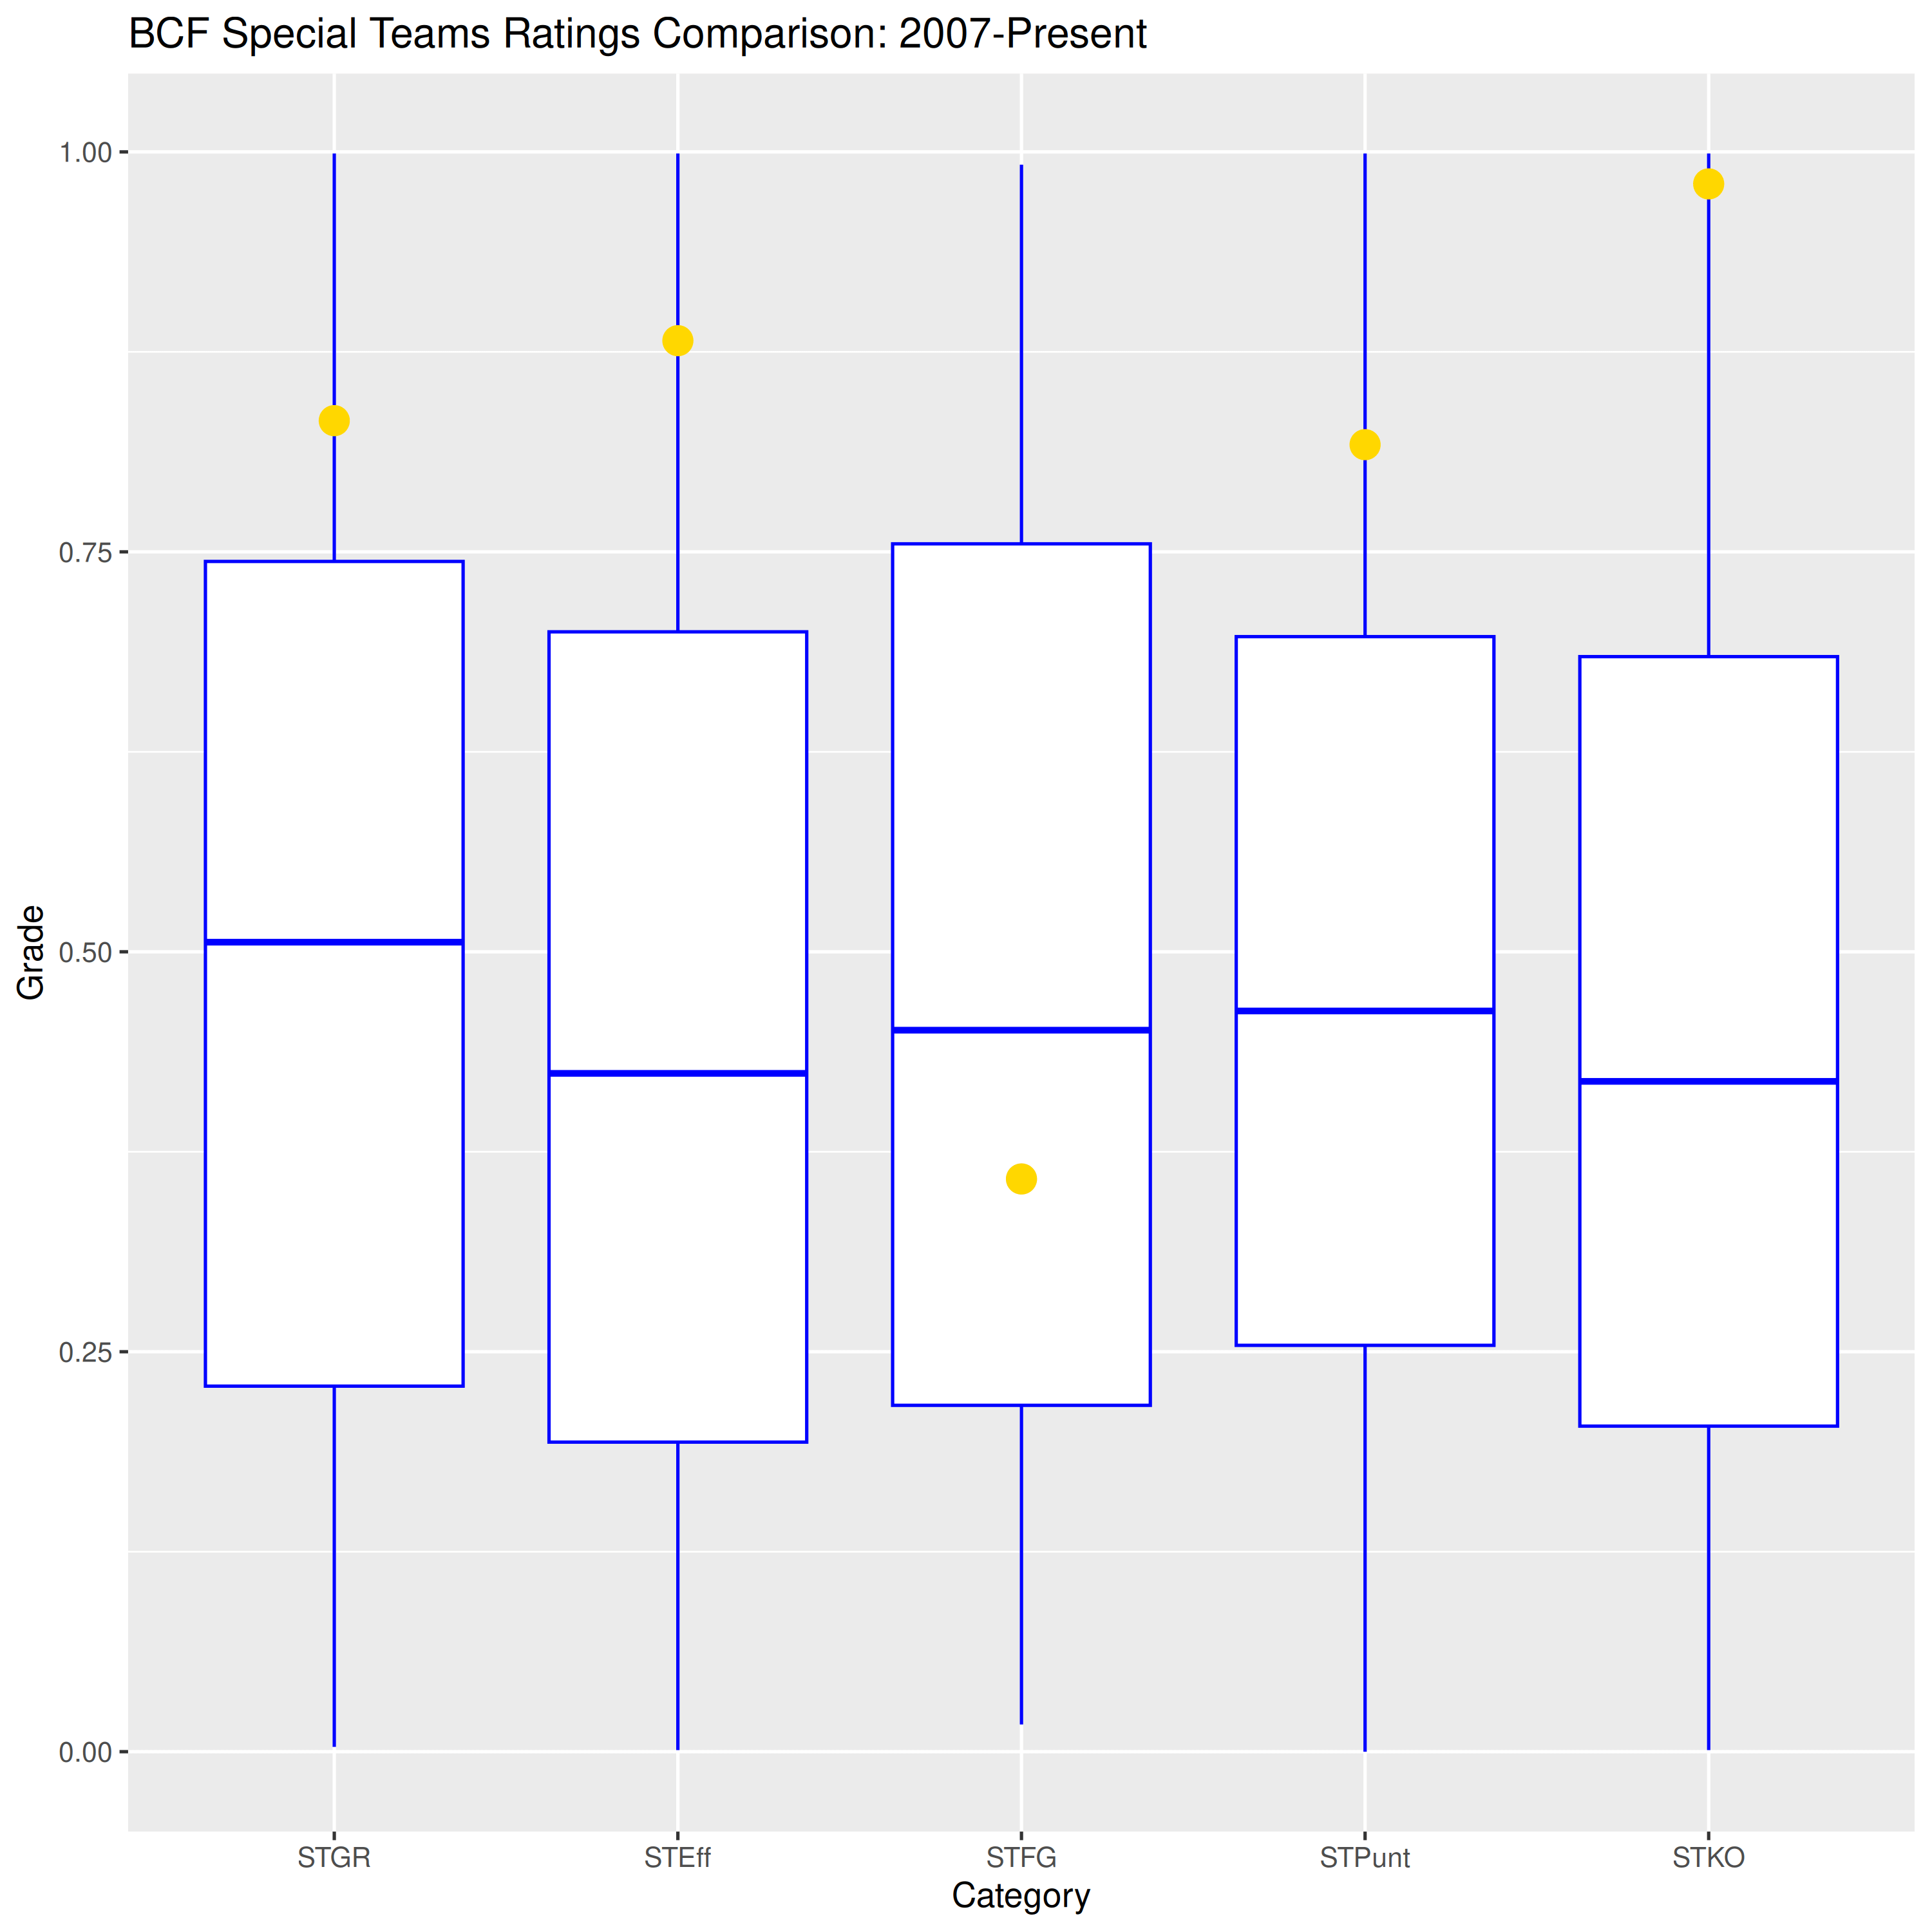
Finally, a good special teams day (except field goals, because Cal’s kicking game has been in purgatory for several years now). Although this positive set of results also reflects UNLV’s critical special teams mistakes, like the fumbled kickoff.
BCF Ratings Clusters
Offense was bad, defense was bad, special teams had a pleasant day. So where does that put us?
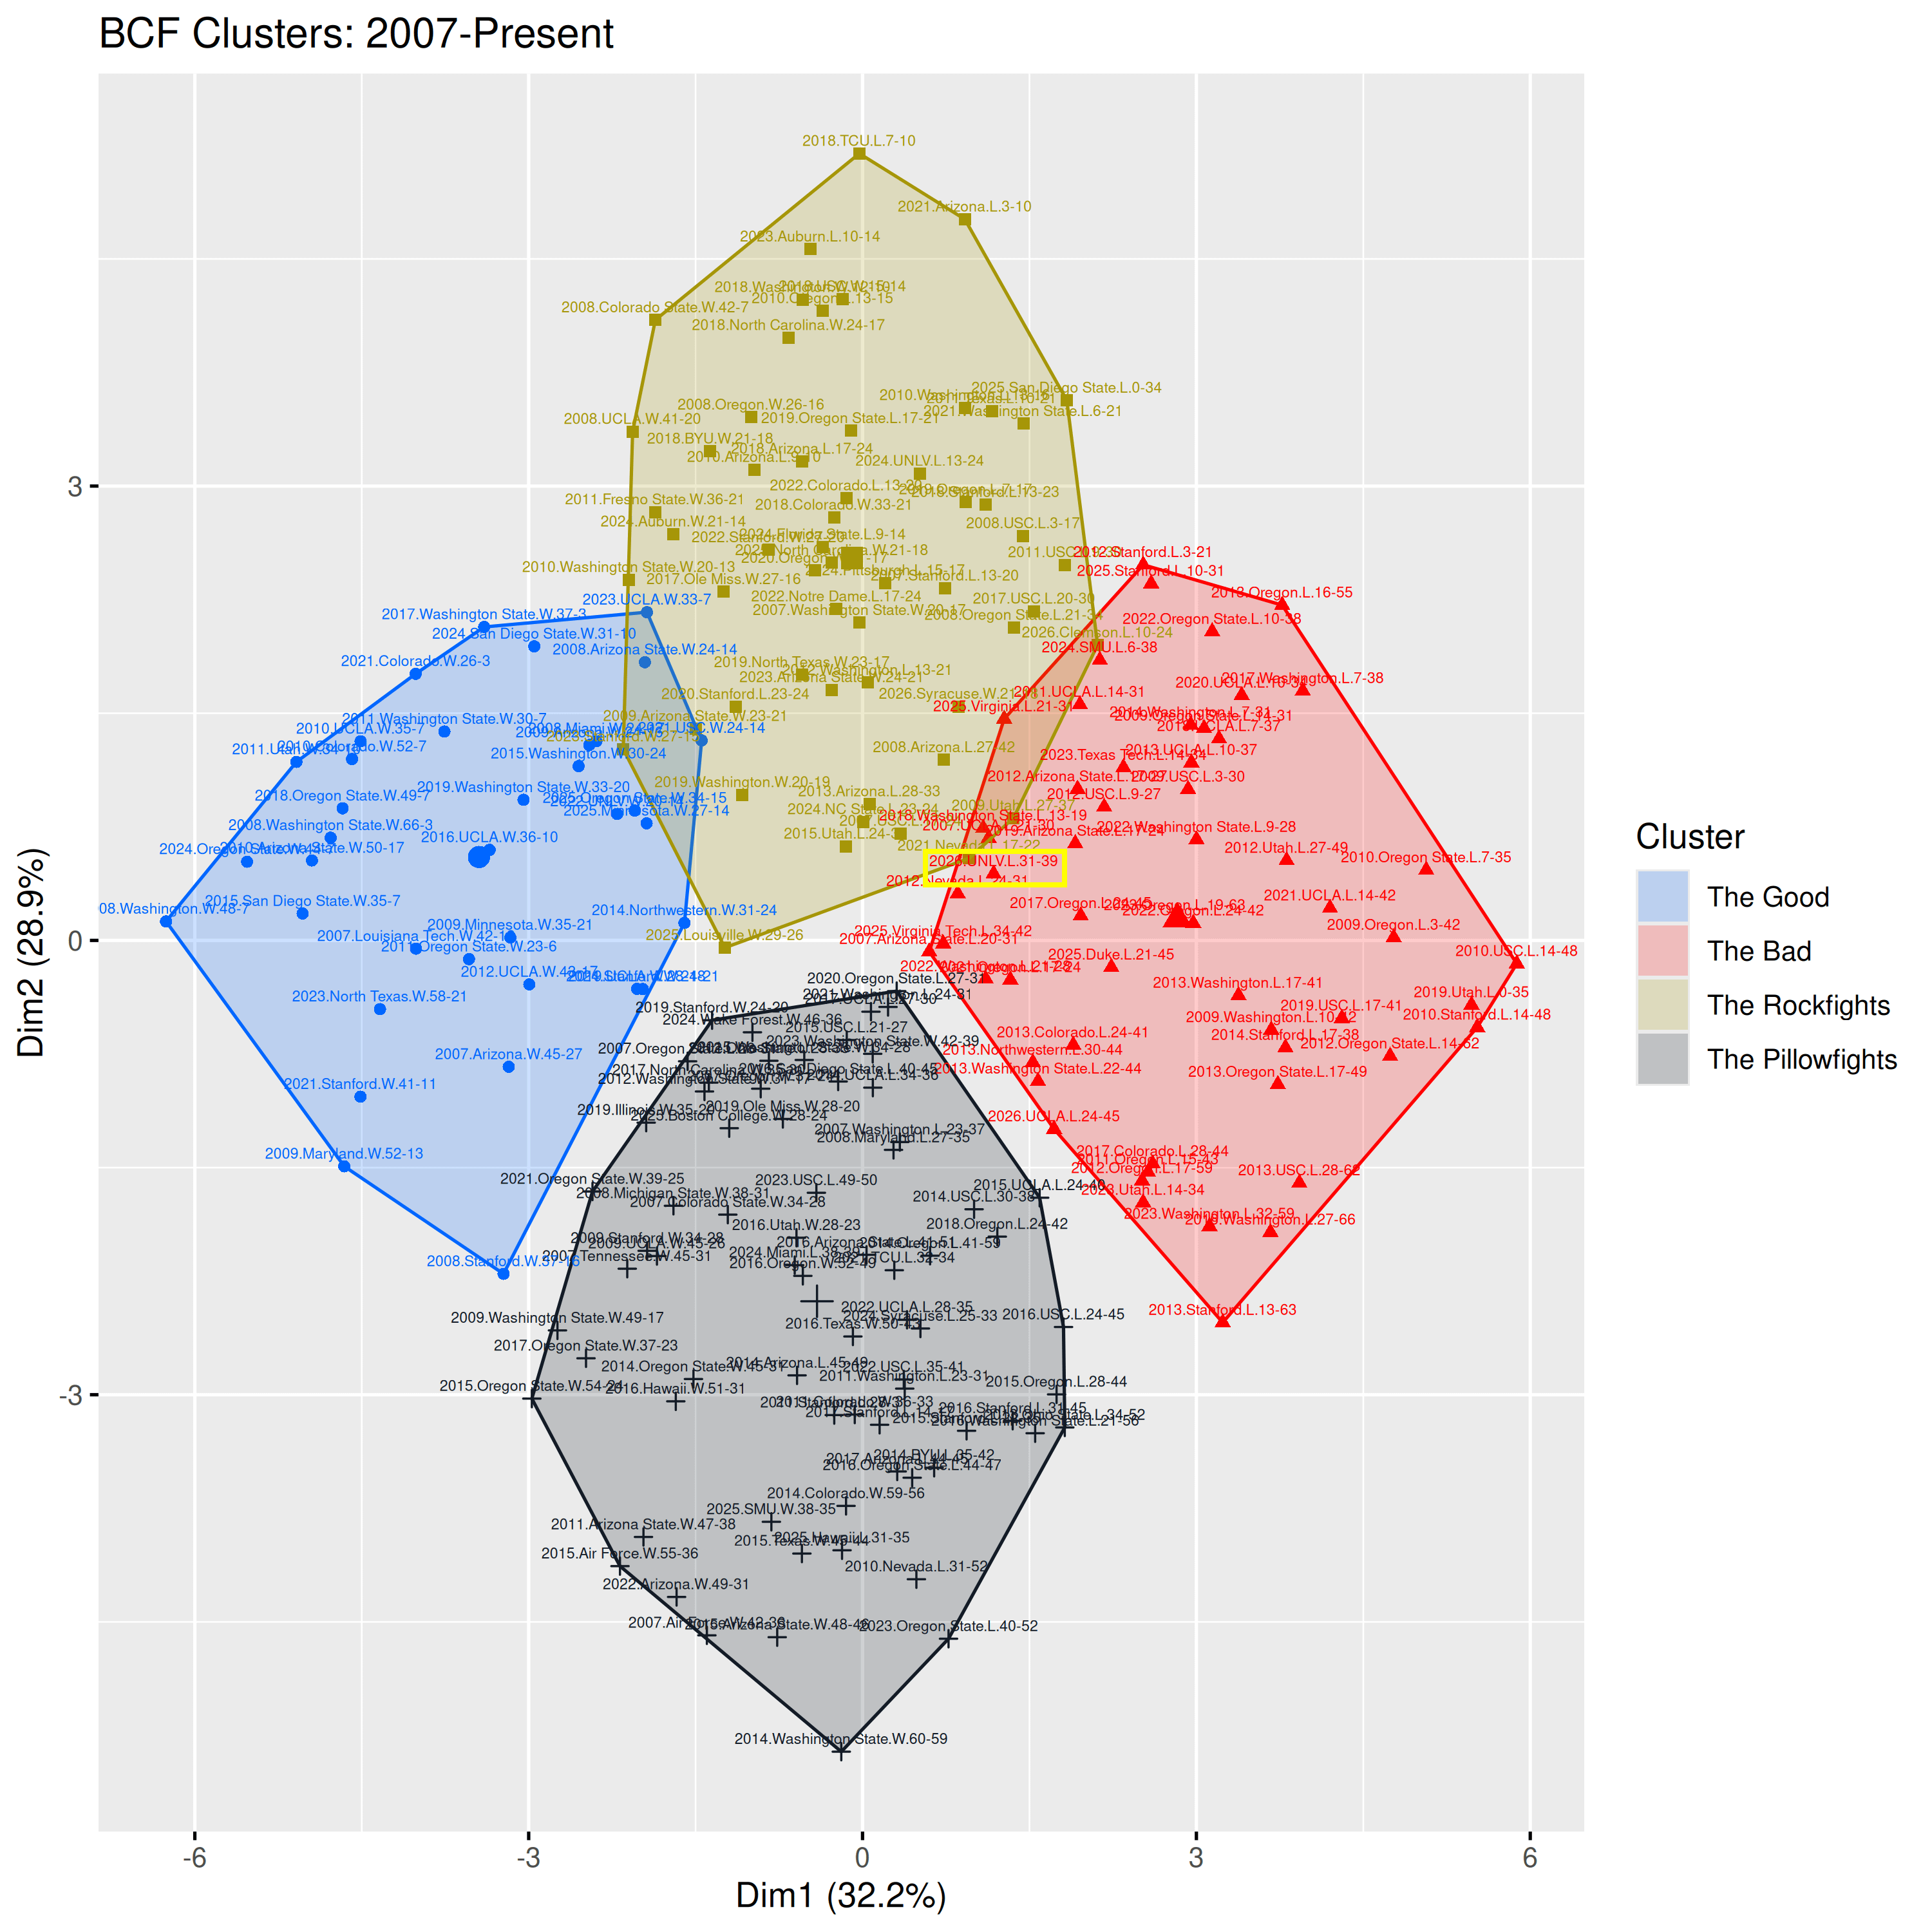
The Bad, once again. We have run this piece four times this season and every result has been the same. The only silver lining is that two of those Bads have since been reclassified as Rockfights (reminder: games on the periphery of categories can jump back and forth between them as we accumulate more data and the categories continue to evolve). As bad as it’s been, it could be worse. We could be on far right end of The Bad, among some of the worst performances in recent history. Speaking of which, Virginia Tech rolls into Memorial Stadium as a double-digit favorite this weekend. Can we finally break this streak of The Bad?
Deja Vu
I pored through the database to find the game with closest ratings to this one, and the result was another particularly painful loss to a MWC opponent: 2012 vs. Nevada (Cal lost 24-31, ruining the grand re-opening of Memorial Stadium and crushing any waning hope that the Tedford could turn things around). Like this loss, Cal could pick up yards but could not convert third downs or turn yards into TDs. Likewise, Nevada and UNLV moved the ball well but saw many drives end in punts. In both games the teams combined for 14 punts—587 total punting yards in the UNLV game and 571 in the Nevada game, an unusually large number considering the teams respectively combined for 809 and 814 offensive yards. Such a weird set of games. We should stop playing teams from Nevada.