The Bad, the Worse, and the Dumpster Fires: Cal at Virginia
A mid-season pivot continues to breathe new life into our analyses while the product on the field continues to stagnate.


Welcome back to The Good, the Bad, and the Rockfights The Bad, the Worse, and the Dumpster Fires, our newly revitalized weekly exercise where we use statistical analysis of drive data to understand just how far into a pit of despair the Bears fell this week. We may be approaching the holiday season, but it feels like Groundhog Day because we keep reliving the same result over and over and over. Case in point: Cal once again fell into The Bad this week. But just how bad was this week’s Bad?
Glossary
Want to know what kinds of Cal football games we’re currently identifying, what BCF Toys’ drive ratings measure, or how to read the Good-Bad-Rockfight-Pillowfight chart? This section should answer any questions you have about the plots and analysis. Otherwise, skip ahead to the plots.
Types of Cal football games
Good: Cal moves the ball productively and efficiently, and turns possessions into points. Meanwhile the defense stops the opponent’s drives early and prevents scoring opportunities.
Bad: The opposite of The Good: Cal can’t move the ball well or efficiently and cannot turn possessions into points. Meanwhile the defense surrenders many yards, long plays, and points.
Rockfight: These are led by strong defensive performances where the defense forces the opponent to grind out inefficient drives that usually end in a punt or turnover. Meanwhile, the offense replicates that struggle. These games are usually dictated by the rule of 21: first team to score 21 wins.
Pillowfight: both offenses can do whatever they want while the defenses are powerless to stop them. These are high-scoring shootouts that are usually decided in the waning minutes of the 4th quarter.
Plots
Boxplots: a boxplot illustrates the spread of data points. The plots used in this series highlight the most recent game’s rating in gold while the remainder of the data points are represented in the boxplot. The box captures data between the 25th and 75th percentiles while the horizontal line represents the median, or midpoint of the data. tl;dr: above the box = great, above the line = good, below the line = bad, below the box = turrible.
Cluster diagram: this illustrates our Good, Bad, Rockfights, and Pillowfights clusters. Each data point represents a game, and points closer together received more similar ratings while points farther apart received more dissimilar ratings. We use a k-means clustering algorithm to organize the games into four distinct clusters, which are color-coded in the plot.
BCF Toys Ratings
(the same ratings are used for offense and defense, so I will only define them once)
Game Rating (GR): opponent-adjusted FEI offense rating, capturing the expected scoring advantage the offense had against the opposing defense (and vice versa, for the defensive rating)
Efficiency (Eff): same as Game Rating, but the scoring advantage against an average defense
Points per Drive (PPD): points per drive during regulation, non-garbage time possessions (or opponent’s PPD, for the defensive rating)
Success Rate (SR): percentage of non-garbage time drives ending in a TD or FG attempt
Yards per Play (YPP): yards per play on non-garbage time possessions
Available Yards (AYd): the distance covered on a drive divided by the distance to the end zone when the drive began for non-garbage time possessions (basically, the proportion of the field covered during a possession)
BCF Drive Ratings
Our friends at BCF Toys used FEI’s drive data to evaluate the Bears’ performances on offense, defense, and special teams. And after looking over those ratings, we combine them into a recipe that ends up revealing one of several different flavors of Cal football (all terrible, lately).
Offense
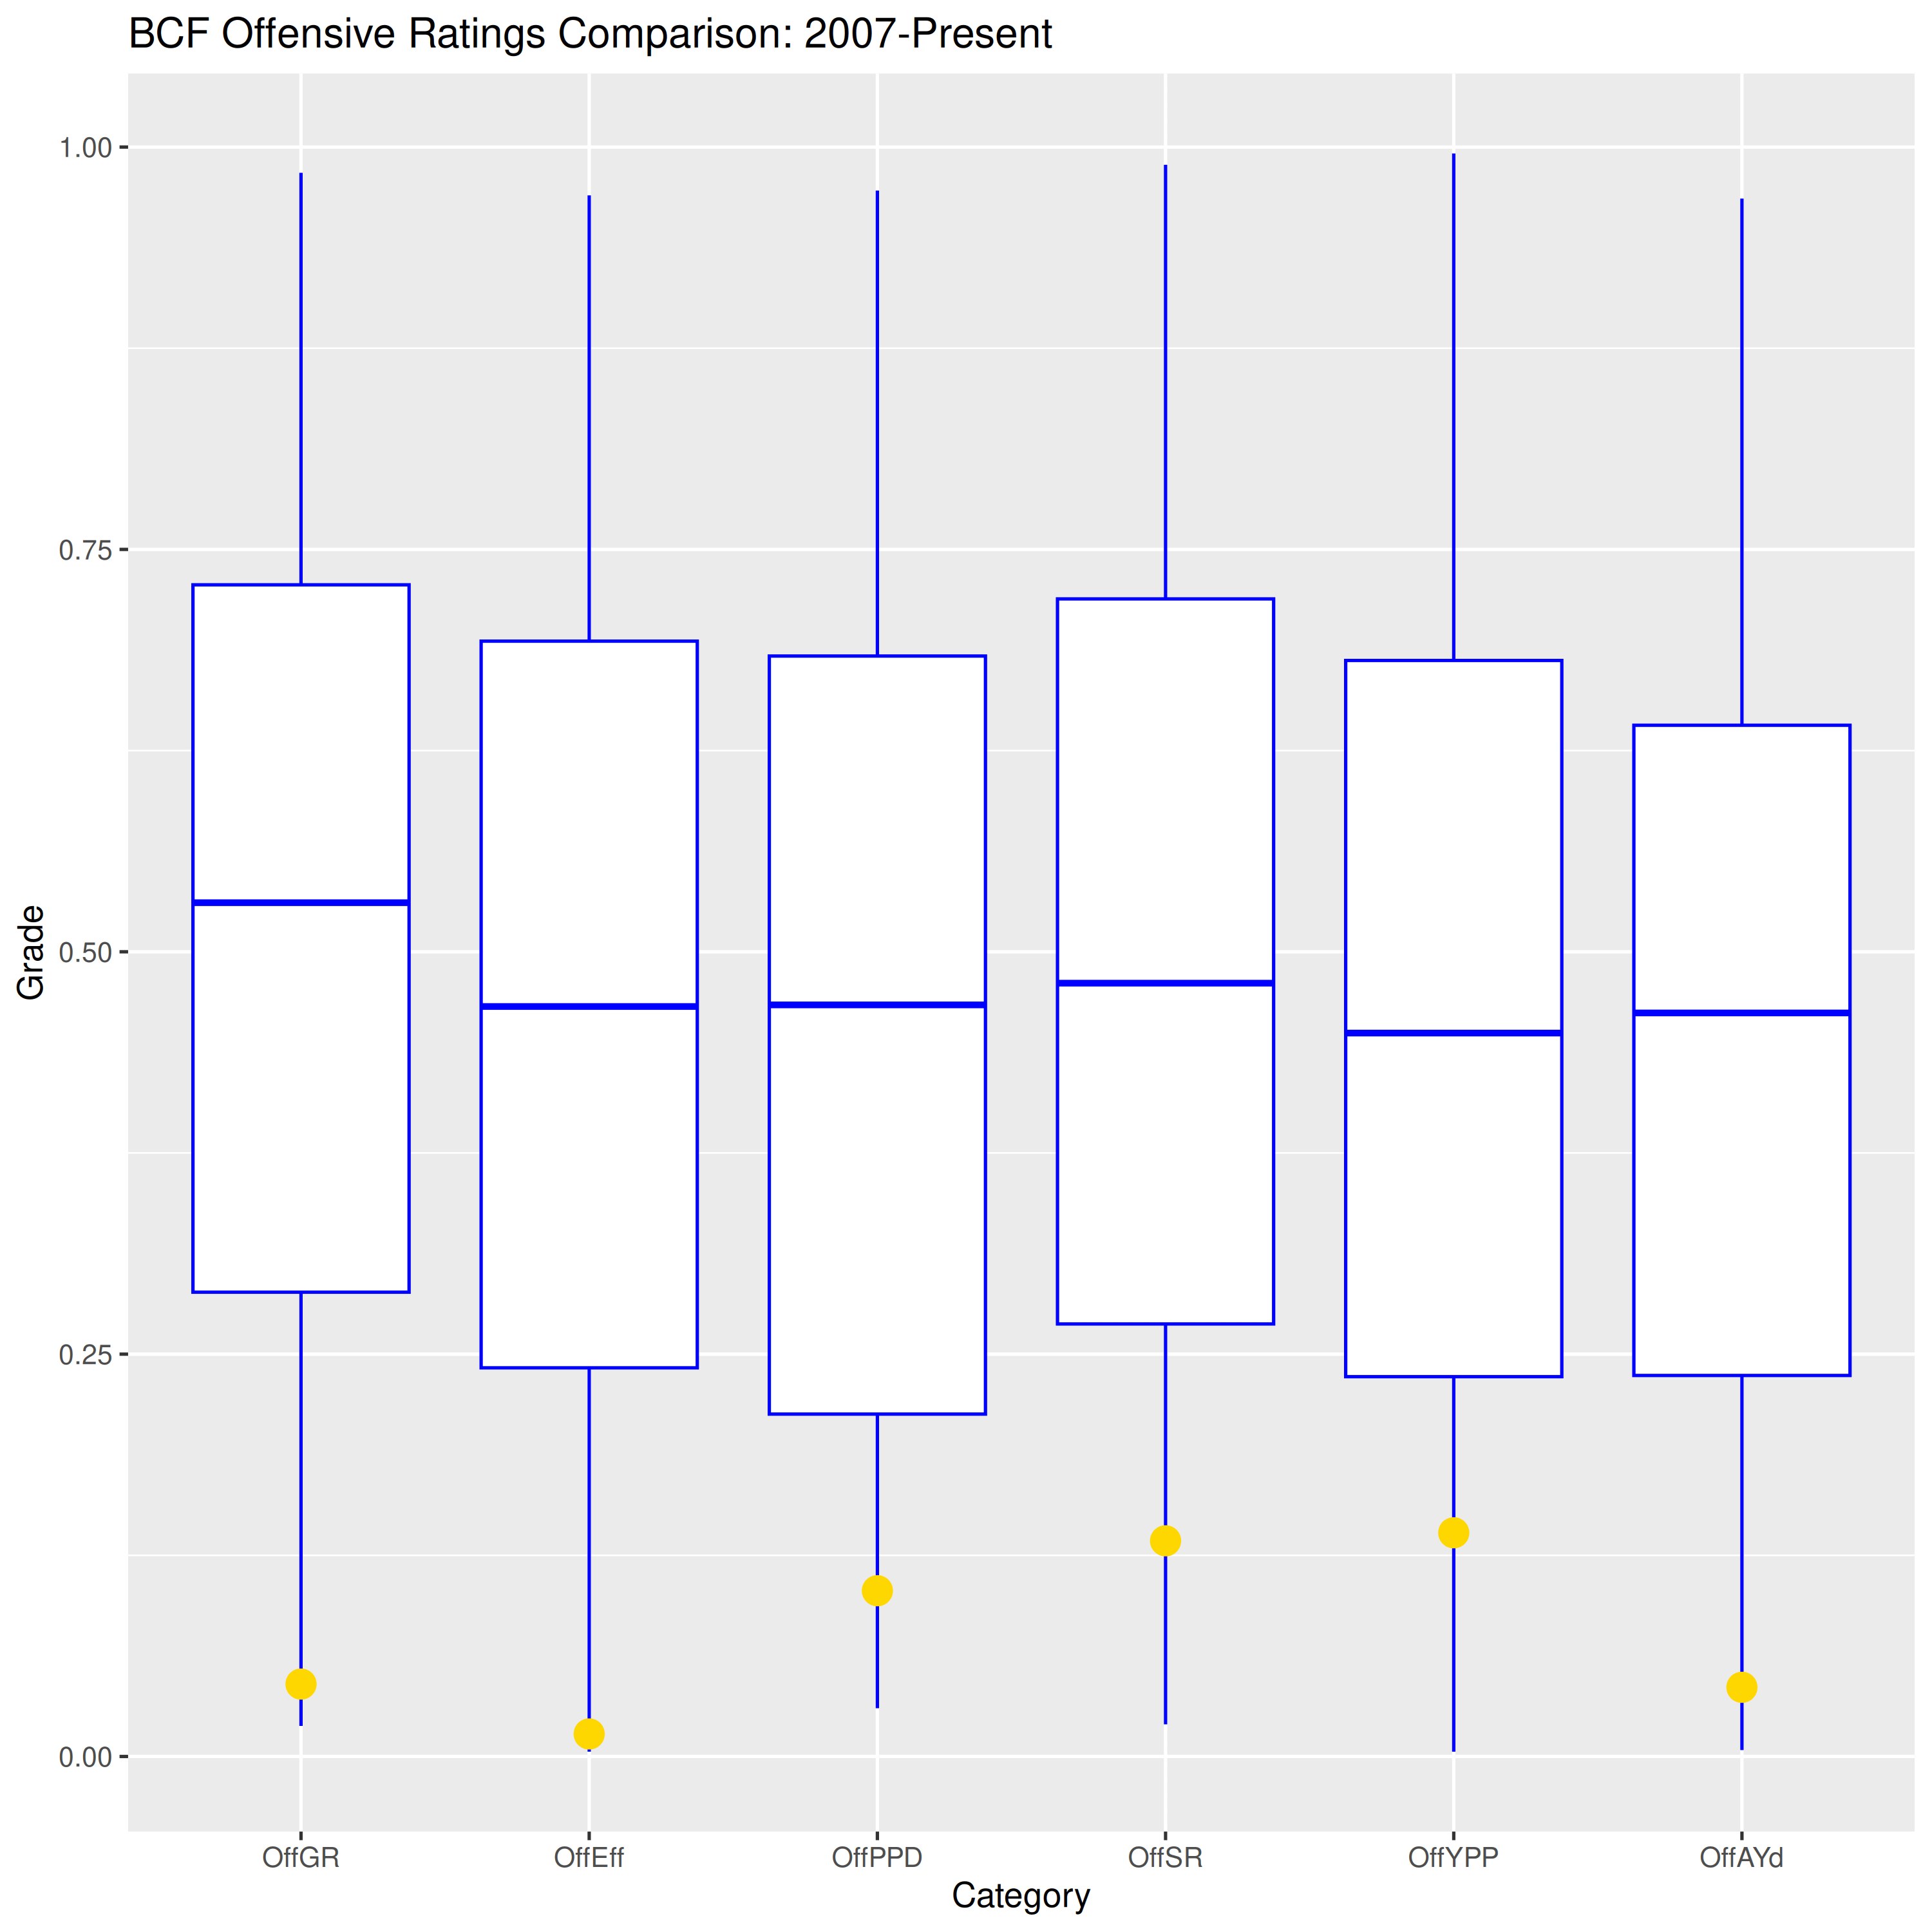
The offense continues to be fundamentally broken and there is no nuance or insight to be gained from that plot. Although I am morbidly curious how much worse that disastrous first pick-six impacted these ratings…
Defense
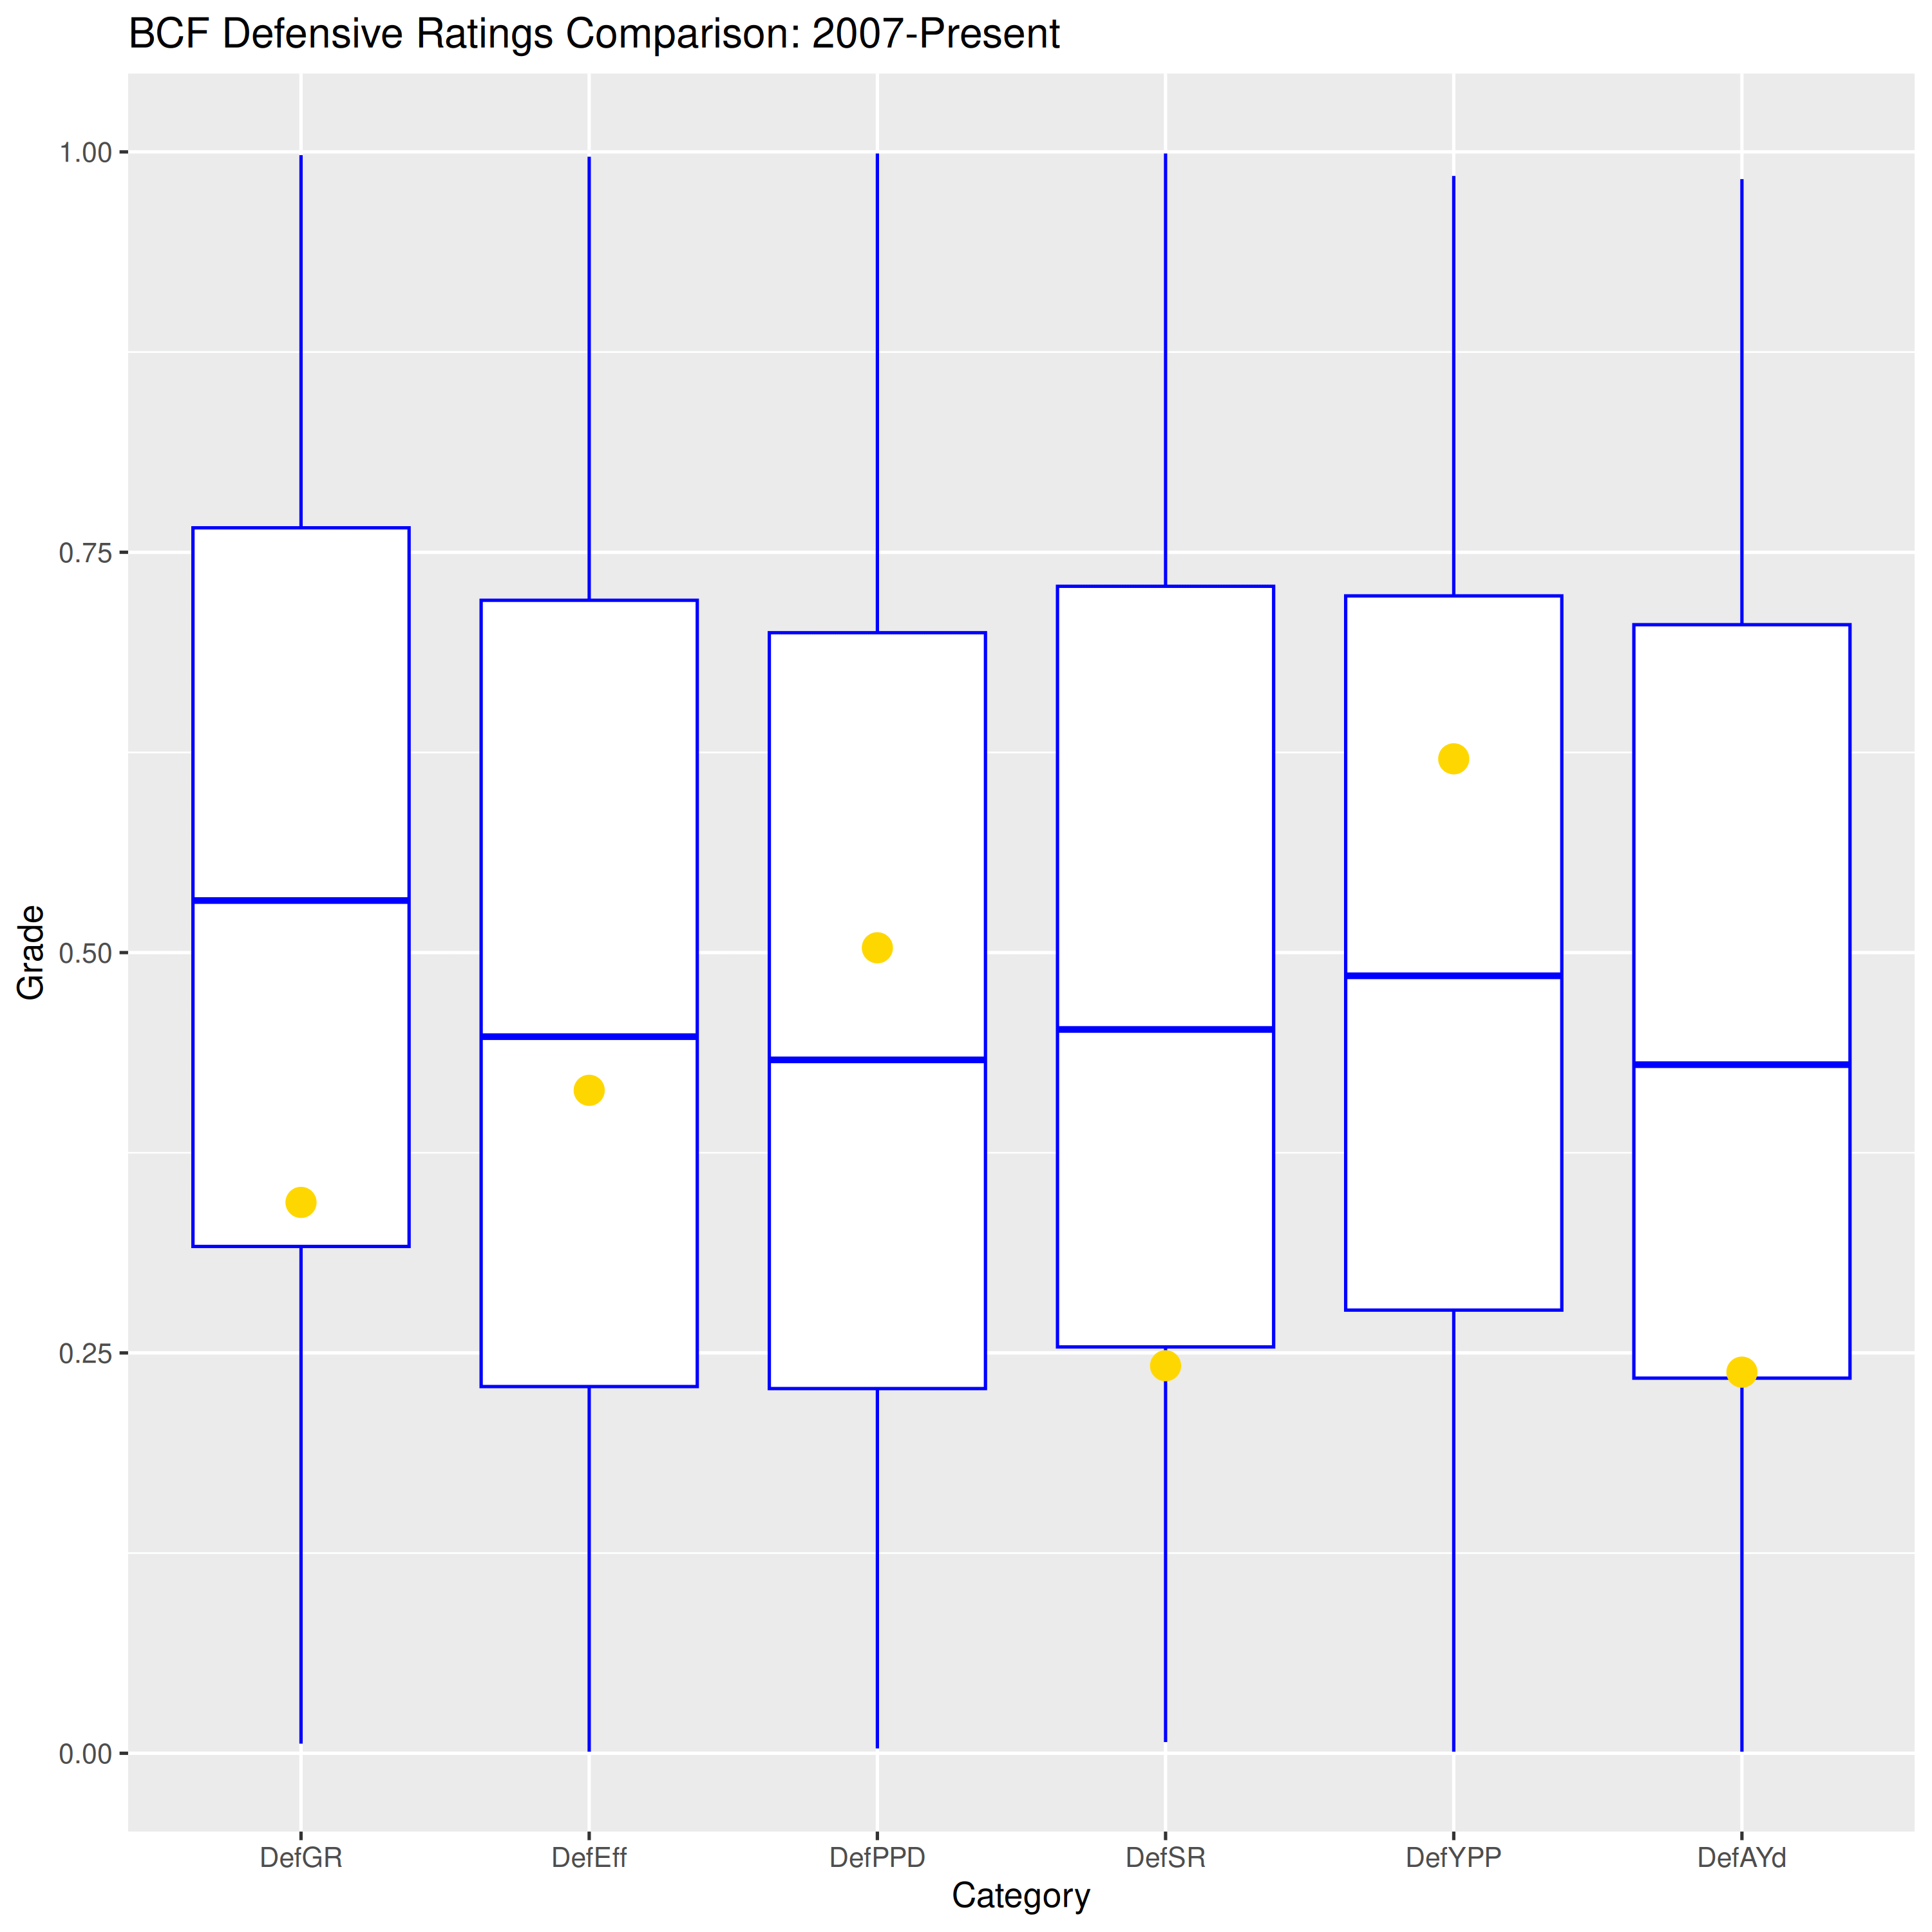
The defense had a more interesting performance profile. The defense earned better-than-usual Points per Drive and Yards per Play ratings because they respectively allowed only one non-garbage-time touchdown drive and forced UVA to engineer long, plodding drives to score points (except that garbage time TD). From a points standpoint, the defense had a decent day by only contributing to 22 of UVA’s 36 points. However, they allowed the UVA offense to accumulate the yards needed to get into scoring position, which explains the low Success Rate and Available Yards ratings. The highs and lows of the performance averaged to a slightly-below-normal Efficiency rating and a much-lower Game Rating, reflecting FEI’s low rating of the Hoos.
Special Teams
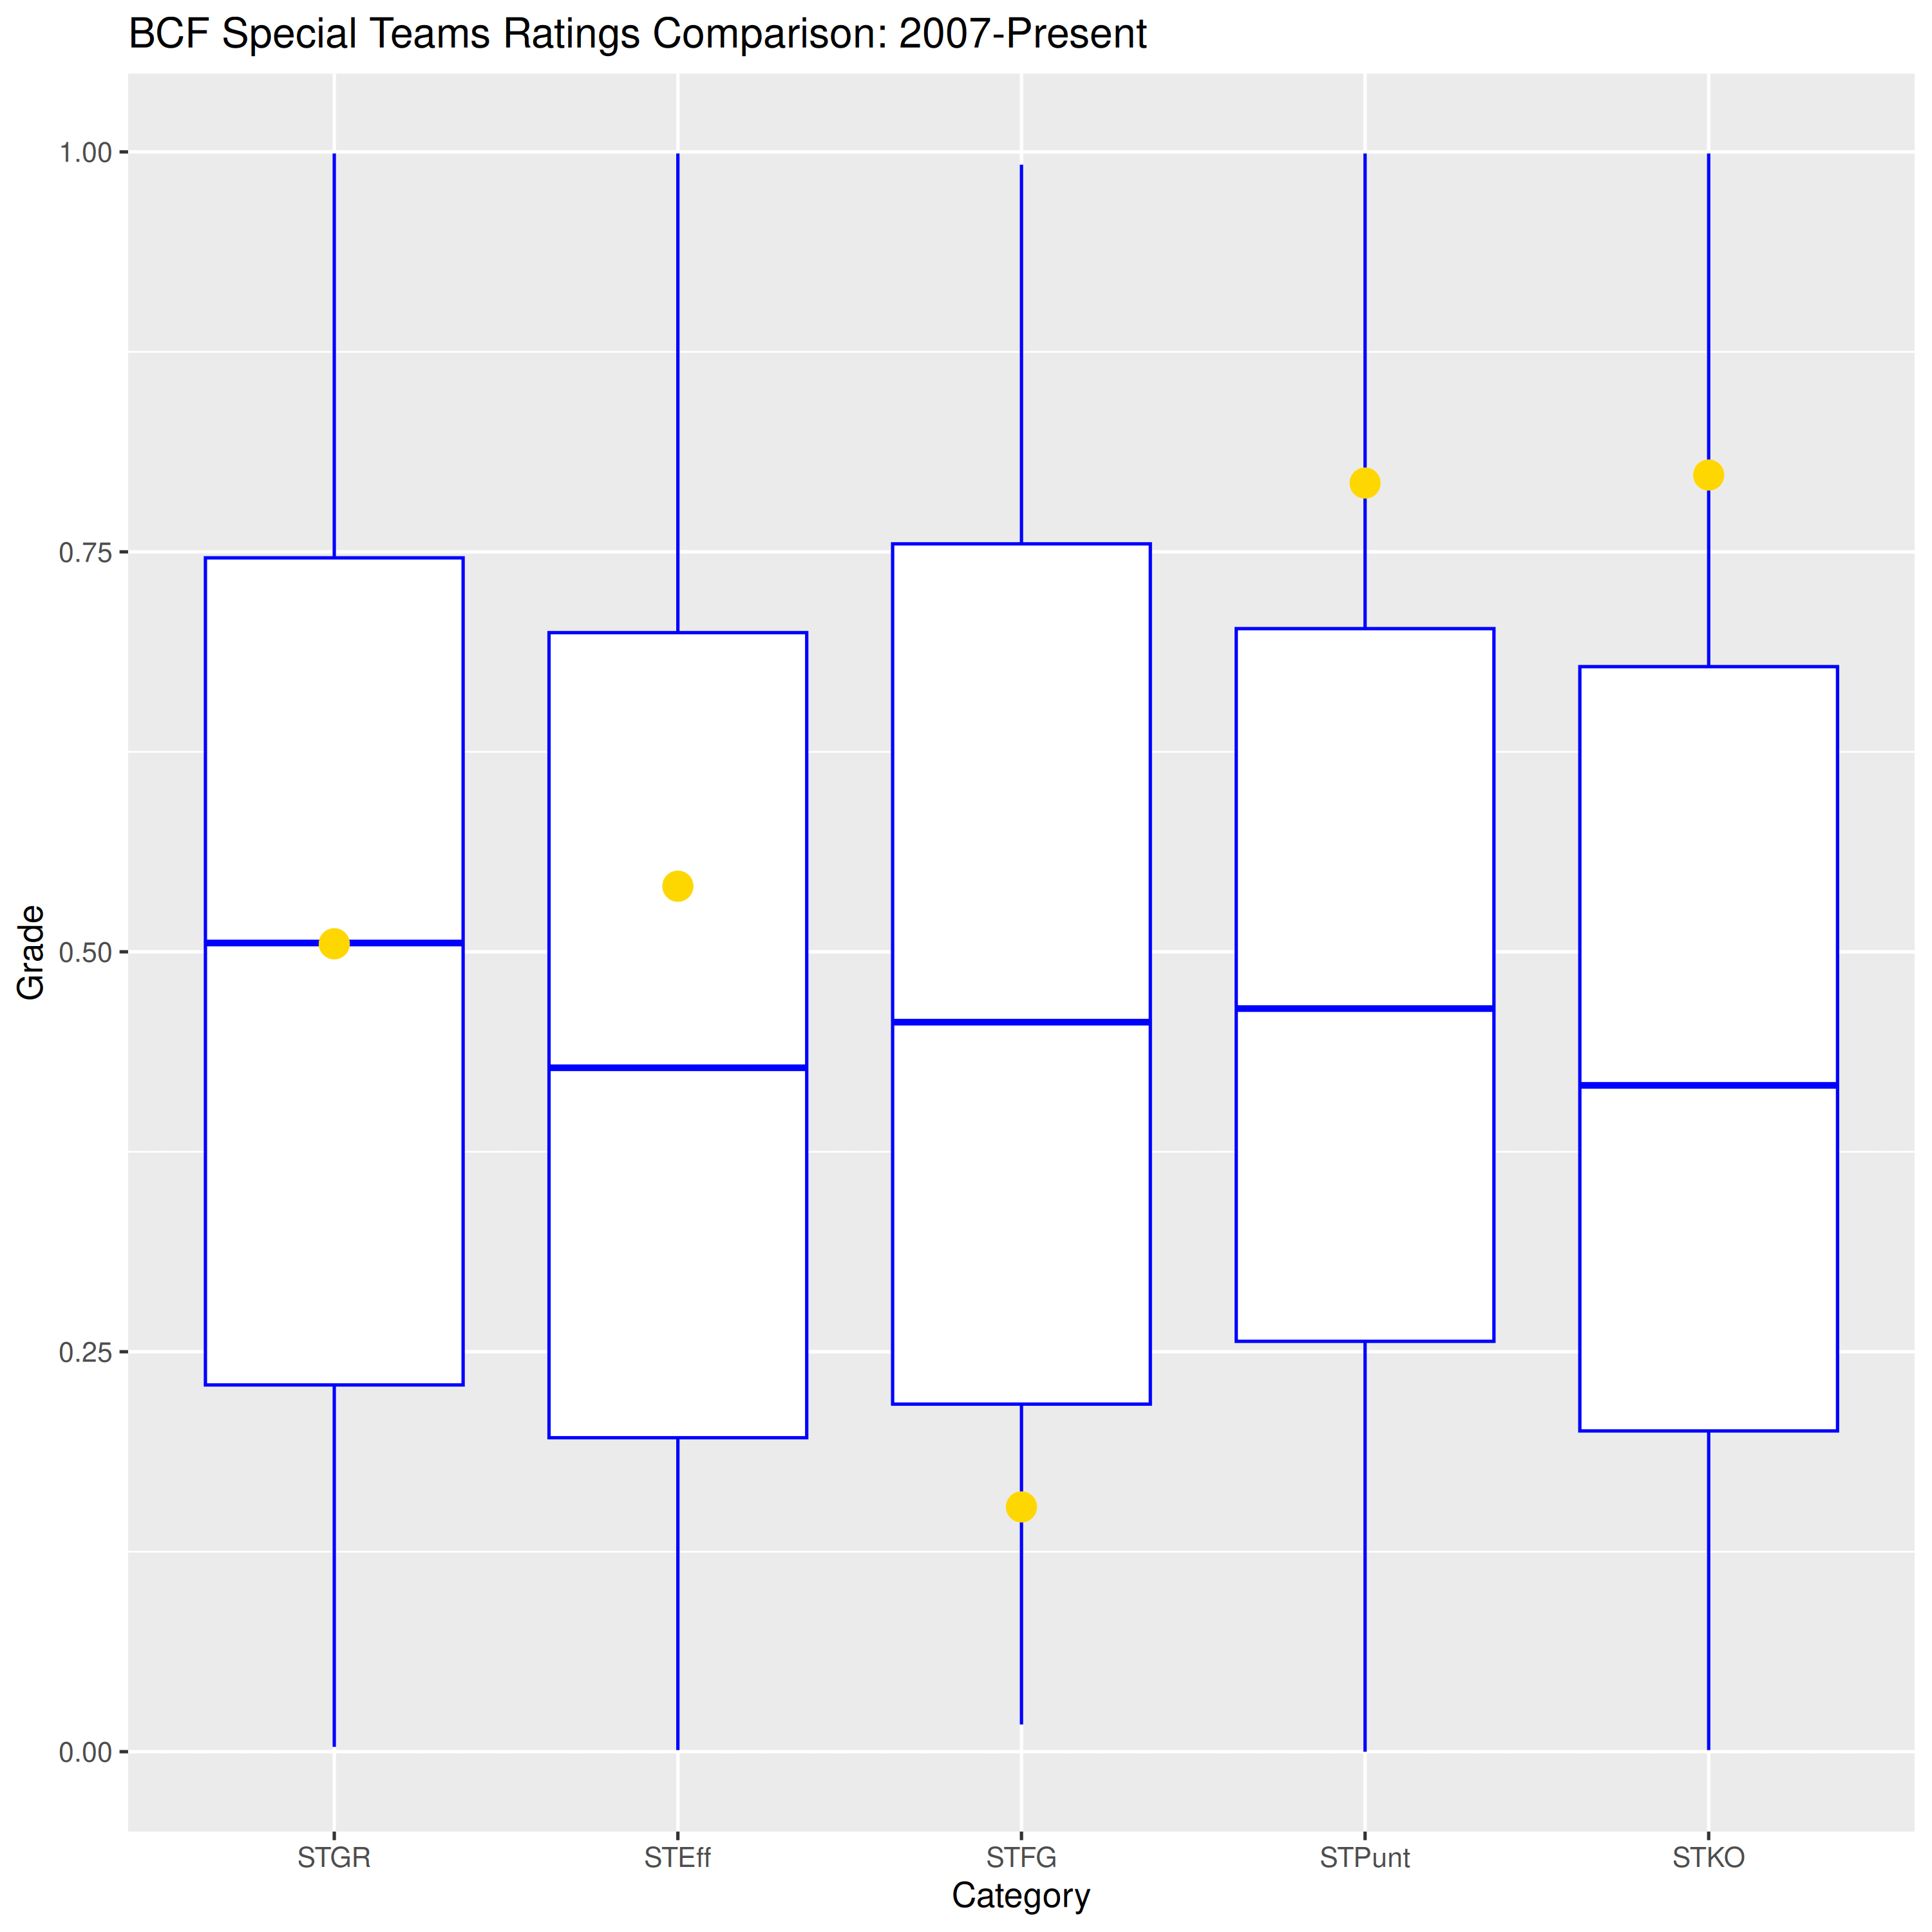
UVA outkicked Cal 3-0, so we see a low FG rating. Cal tended to get better field position gains on punts and kickoffs than UVA, so their ratings enjoyed a nice boost. Overall, it evens out into a decent special teams efficiency rating.
Cluster Analysis
I took all the ratings, fed them into our clustering algorithm and it once again returned The Bad.
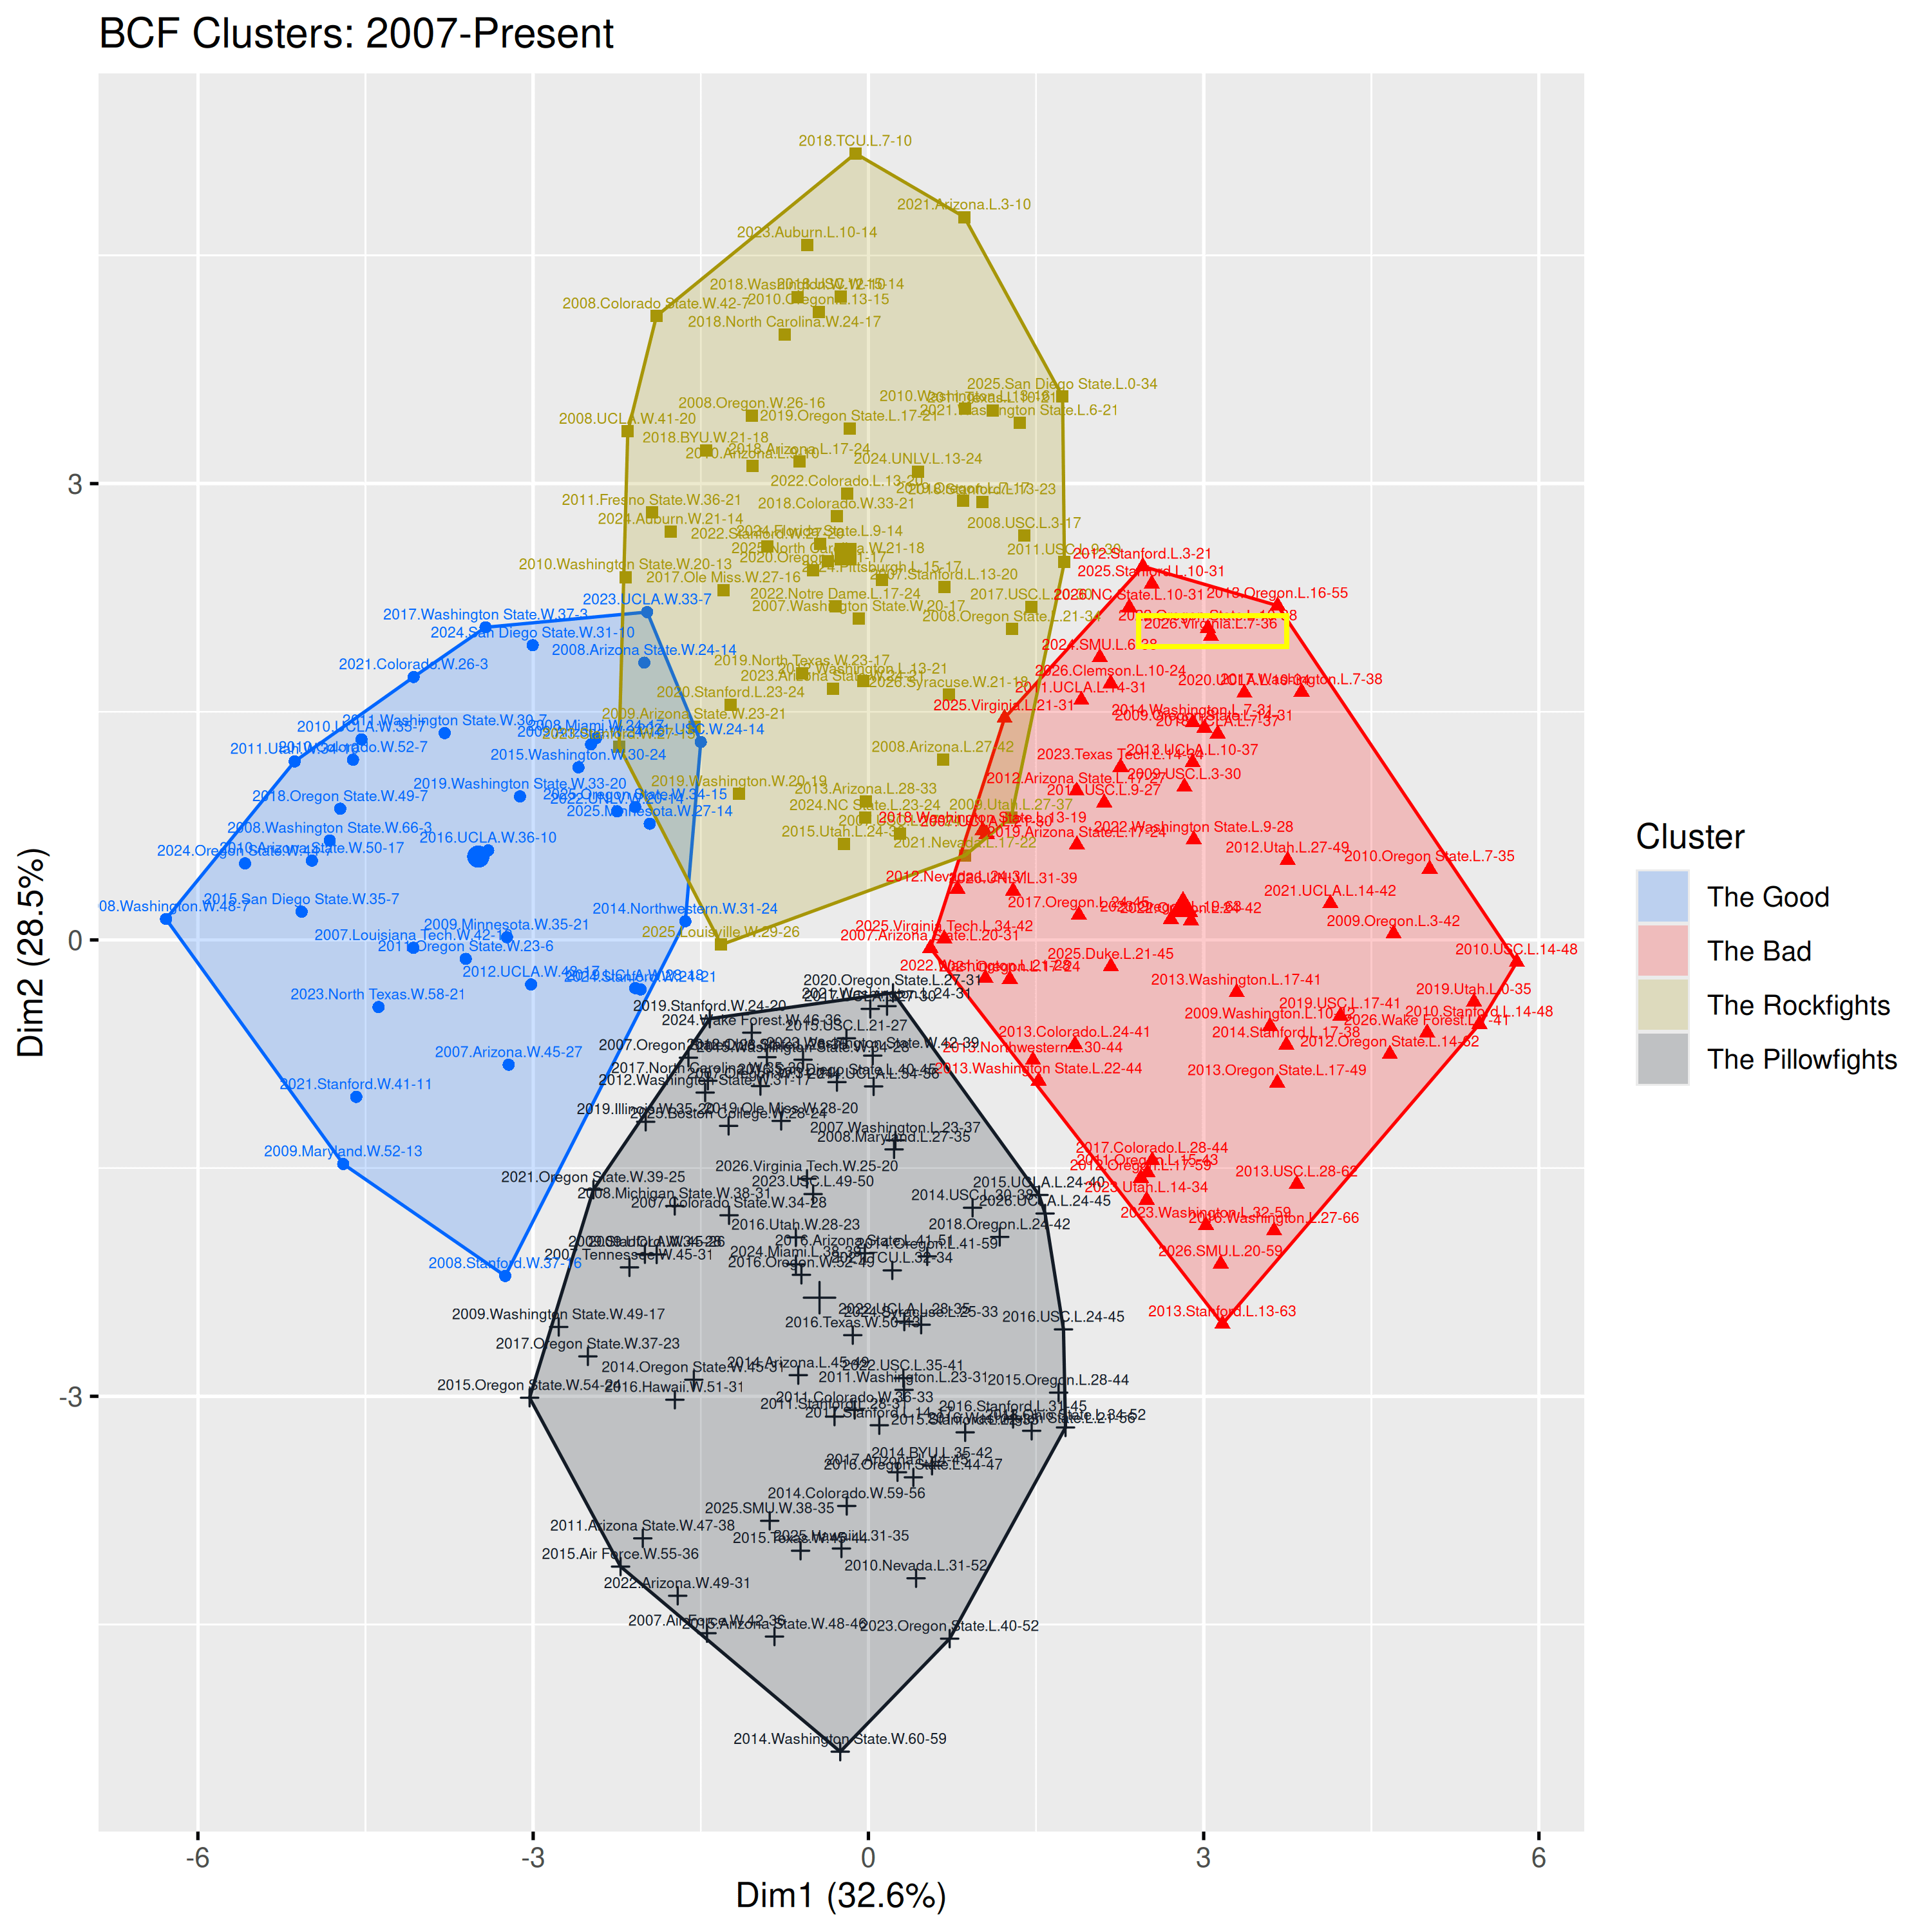
We all knew this was coming. And classifying every game in The Bad is getting tedious, so we’re repeating last week’s analysis to figure out just how bad this Bad was.
Bonus Cluster Analysis
I fed the data from all the Bad games into our clustering algorithm, which further classifies them into three types of games: The Bad, the Worse, and the Dumpster Fires.
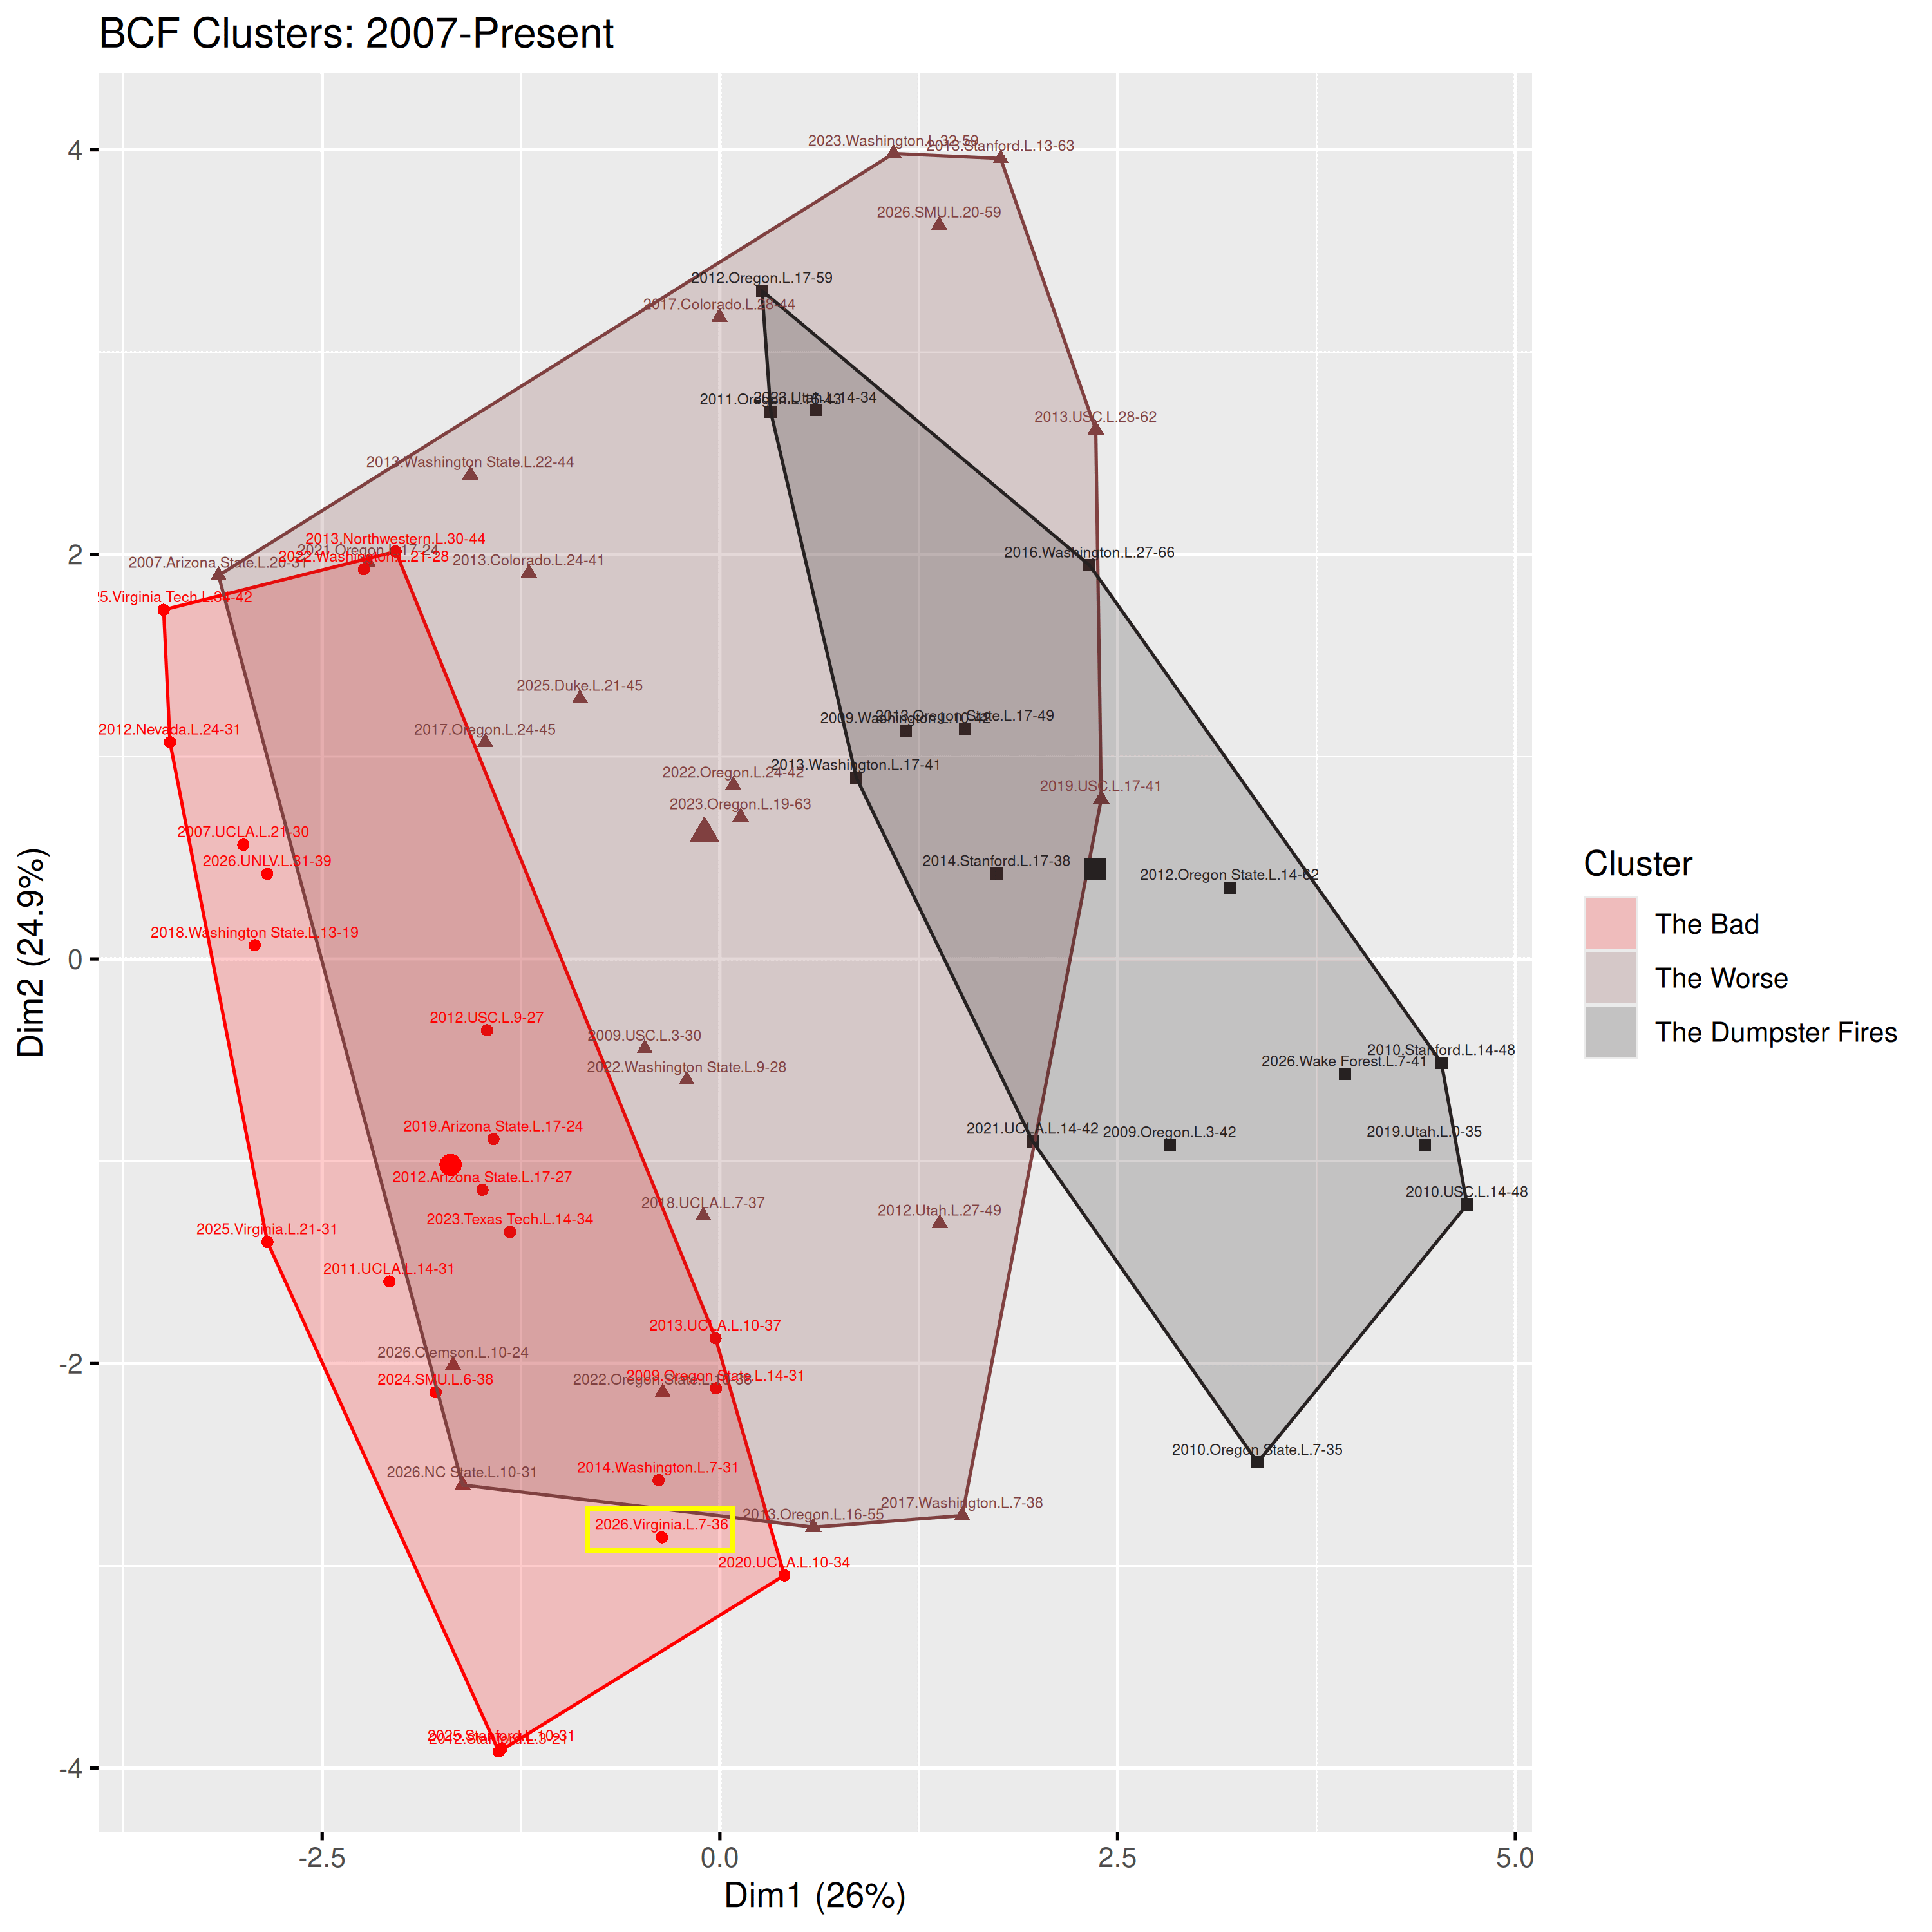
This one merely falls in The Bad, thanks to a not-abysmal day from the defense. Surprisingly, while we have seen two Bad (UNLV and UVA) games and three Worse games (Clemson, NC State, SMU), we only have one Dumpster Fire (Wake Forest) this season. So far.
Deja Vu
I dug through the data to find the game with the most similar statistical profile to this one: the excruciating 14-31 loss to UCLA in 2011, in which a hapless Cal offense (5 turnovers!) could not keep up with Kevin Prince’s 163 rushing yards (a career high that is nearly double his second-best rushing performance). Like the first three quarters of this UVA game, that UCLA game was within just enough reach to give Cal fans hope that the Bears could rally against a woeful foe. Alas, repeating the same series of agonizing mistakes doomed the Bears to a demoralizing loss.
Furd scores 40. We may get 14
Perhaps you are the quant who might be able to consider my suggestion. Each play is charted in detail, but I do not know if that data is readily available to you. My comment and suggestion:
I do not believe Cal and Tosh are beyond all hope. I wish we had analytics of first half vs second half performance in all games except Wagner. First half performances seem to show a flawed but competitive team. A deep, comparative analysis, play by play, might suggest what can be done, and avoided, to realize success. Perhaps the quants at WFC might be able to undertake that analysis. Organizational behavior can be changed with light. Fiat Lux.