

Intro
We are three games into a new season, and it is time to see how our offense measures up to last year’s. For months, we speculated on how big a leap we could expect from second year quarterback Jaron-Keawe Sangapolutele, under new HC Tosh Lupoi and portal additions like RB Adam Mohammed, TE Dorian Thomas, and WR Ian Strong.
As I indicated in this series last season, I do not know ball, but I do know math. For this analysis, I have taken play by play data from the 2025 season (twelve regular season games plus the Hawaii Bowl) to compare against Cal’s offensive performance through the first three games of the 2026 season. Season averages from 2025 give us a baseline against which we can measure the team’s current trajectory.
Playcalls
Question: What proportion of playcalls are passes vs. runs?
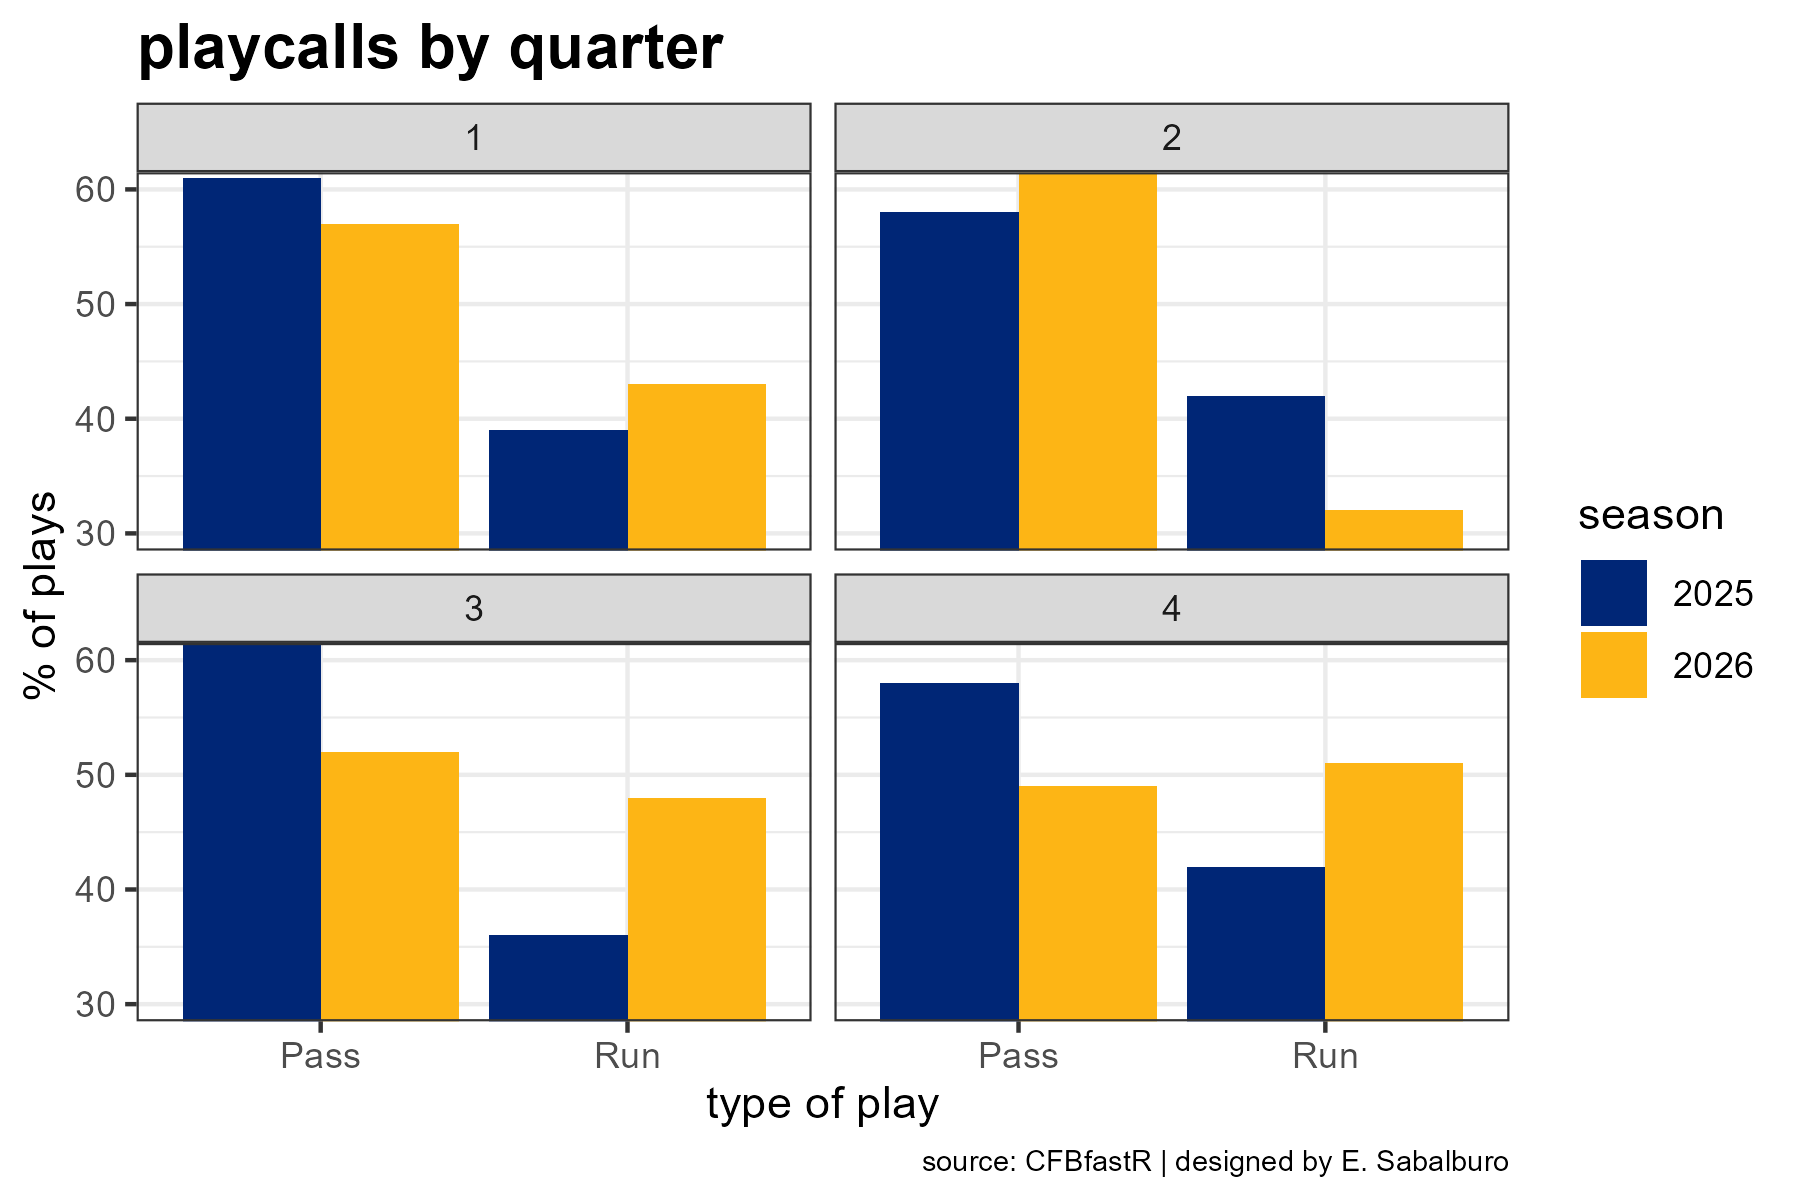
In the first half of the game, our pass/run ratio resembles last season’s, with a little over 60% of offensive playcalls being passes. Last season, our half pass/run ratio did not change between the first and second half, but so far in 2026, our second half offense has tended to nearly equalize the number of pass and run plays called
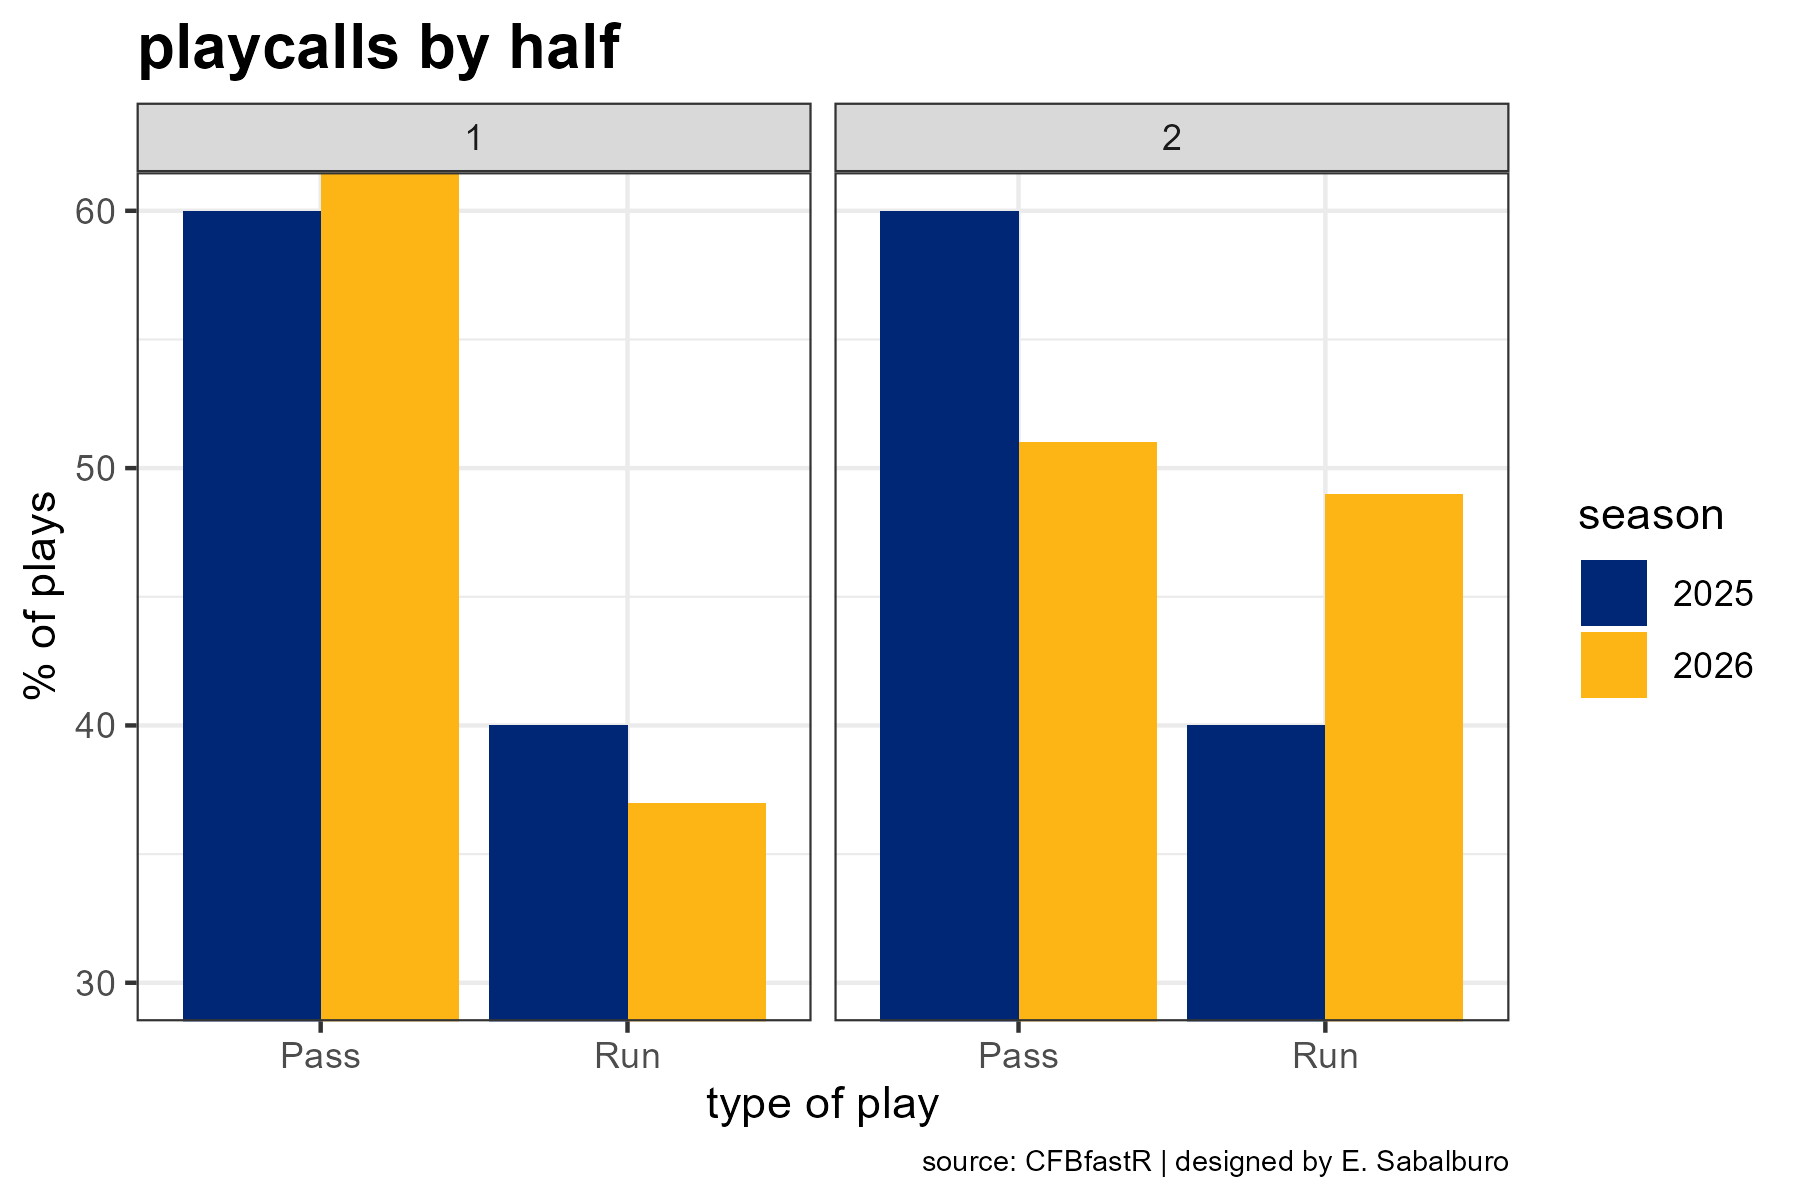
In 2026, both our Q3 and Q4 playcall ratios are hovering around 50/50. Halftime adjustments have resulted in relatively fewer attempts the throw the ball, despite all the (well-deserved) hype around JKS’s ability to throw the ball.
Passing
Question: How has the passing game looked against each opponent?
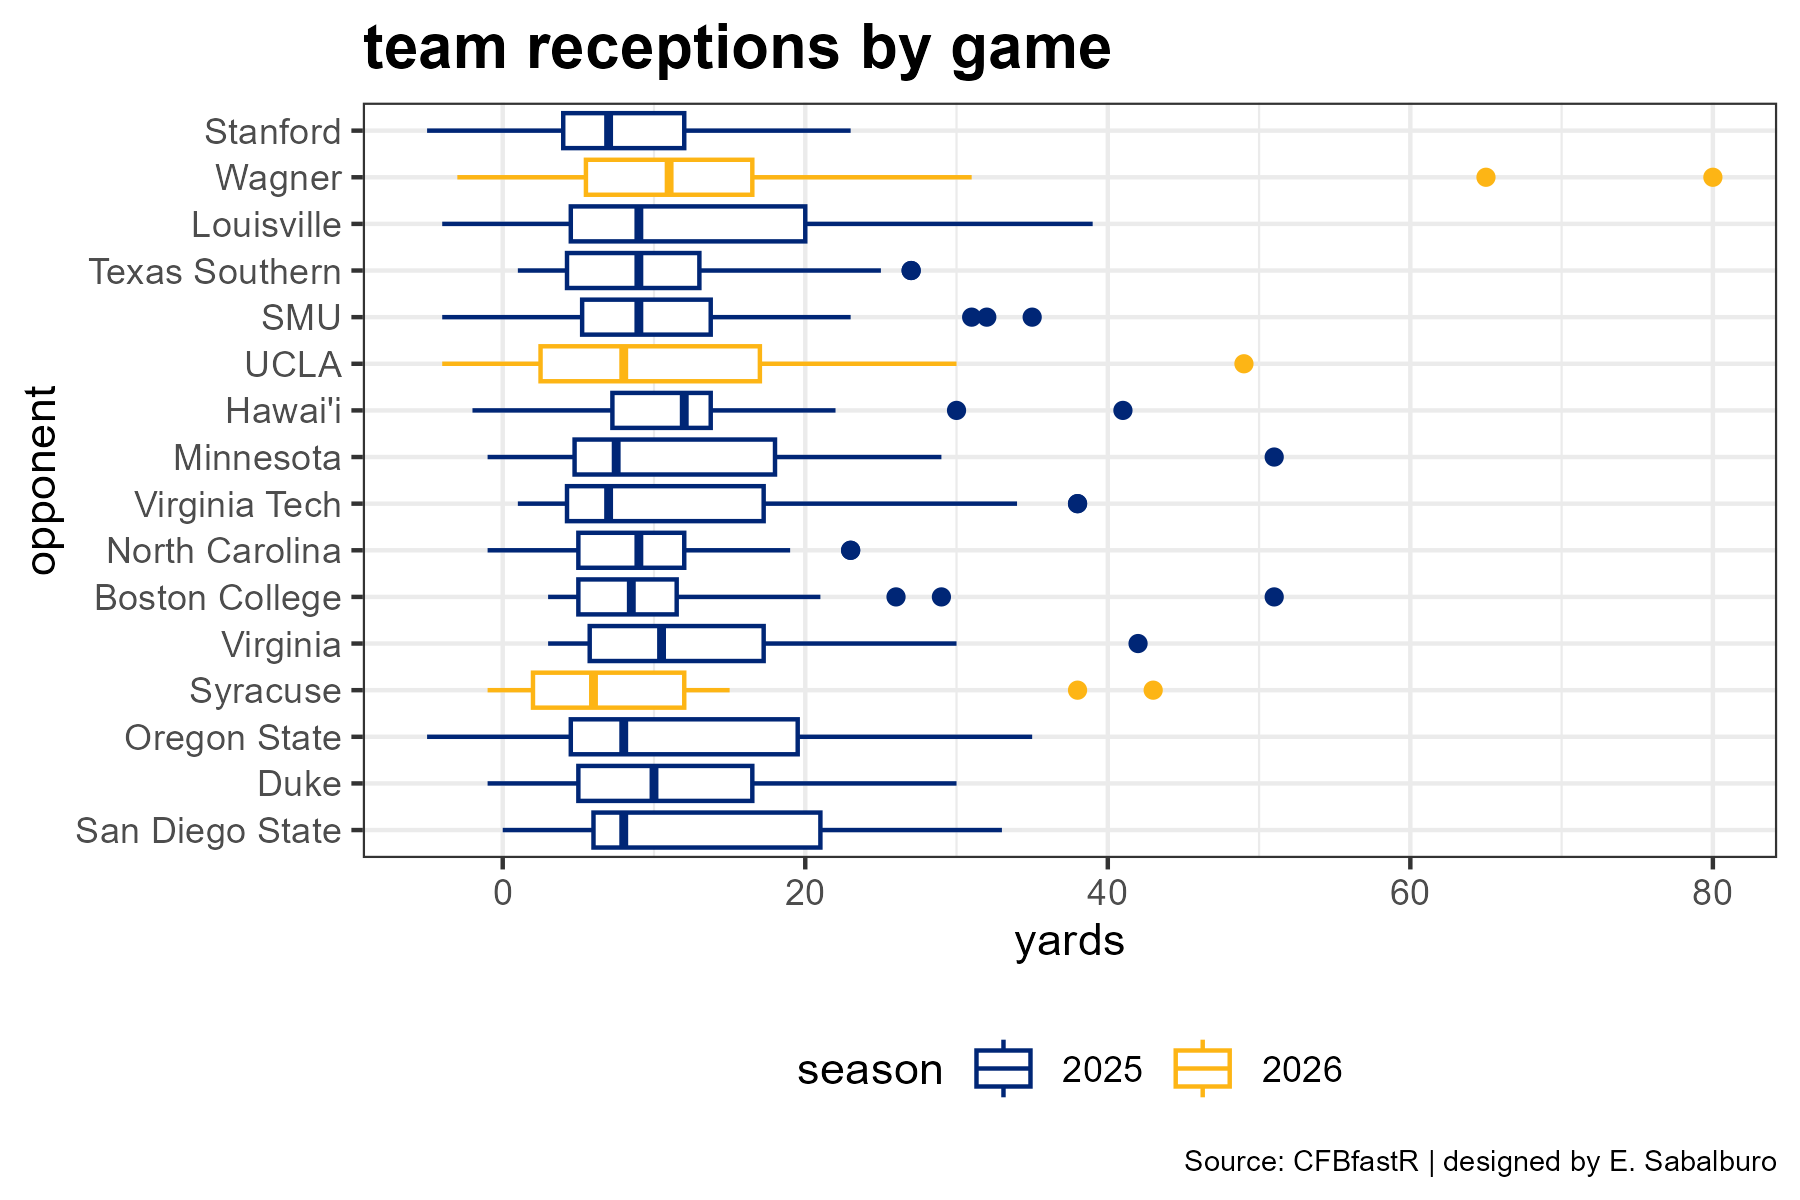
The boxplots here plot receptions by game and season. (Here is a helpful refresher on how to read boxplots.) Games with more completions are listed higher up on the graph. (Yes, the 2025 Big Game loss featured the most catches made of any game in Cal’s last 16 games).
Question: How distributed is our passing game among the receiver room?
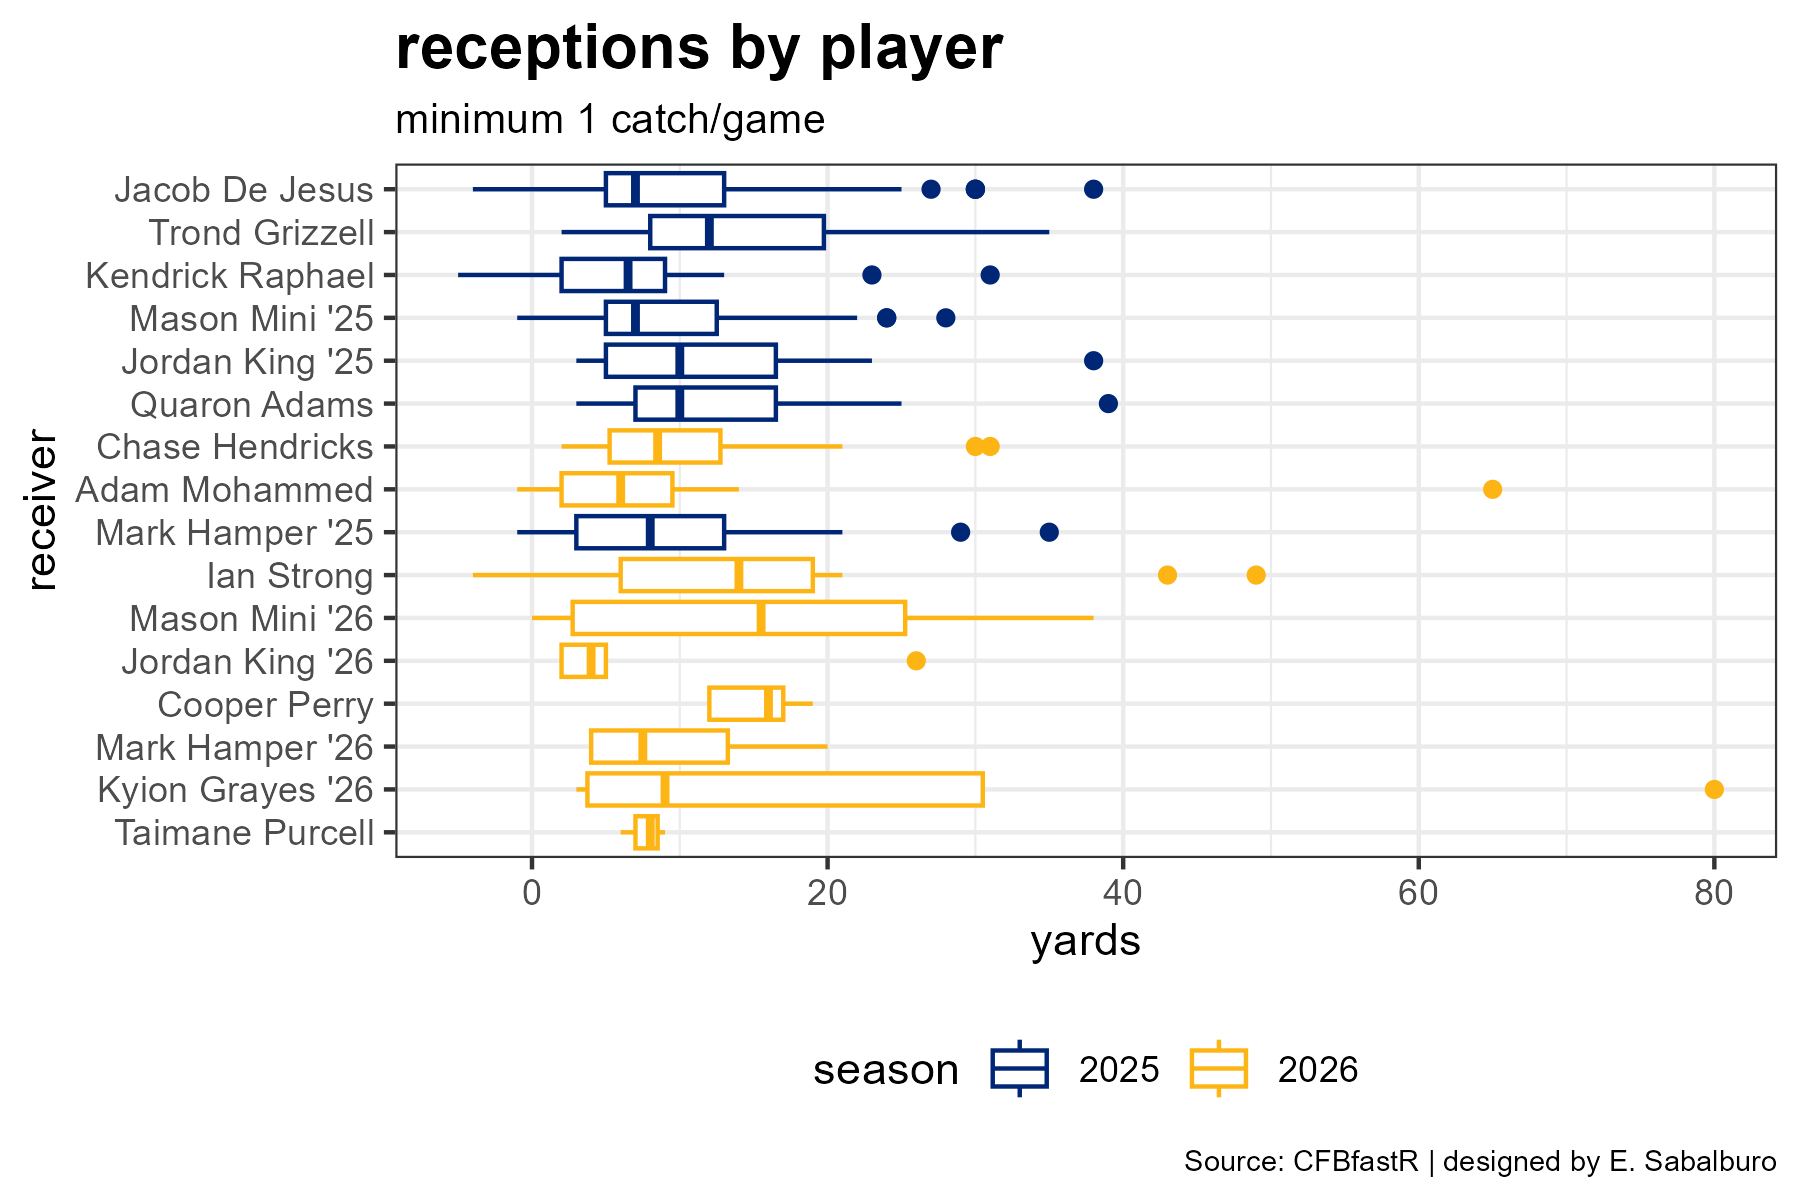
Below I disaggregate the data to show receptions by player and season. I only include receivers averaging at least one catch per game. 2026 players need to have made at least three catches thus far, and 2025 players need to have made thirteen catches over the course of last season.
Players with more catches per game are listed first, so we can see here that on a per-game basis, nobody is matching the pace of catches made by our six top receivers last year. This is not a bad thing in and of itself; it’s possible that our passing game this year has more credible catching threats. Be sure to note how this graph changes over the course of the season.
Question: How does the passing game compare to last year overall?
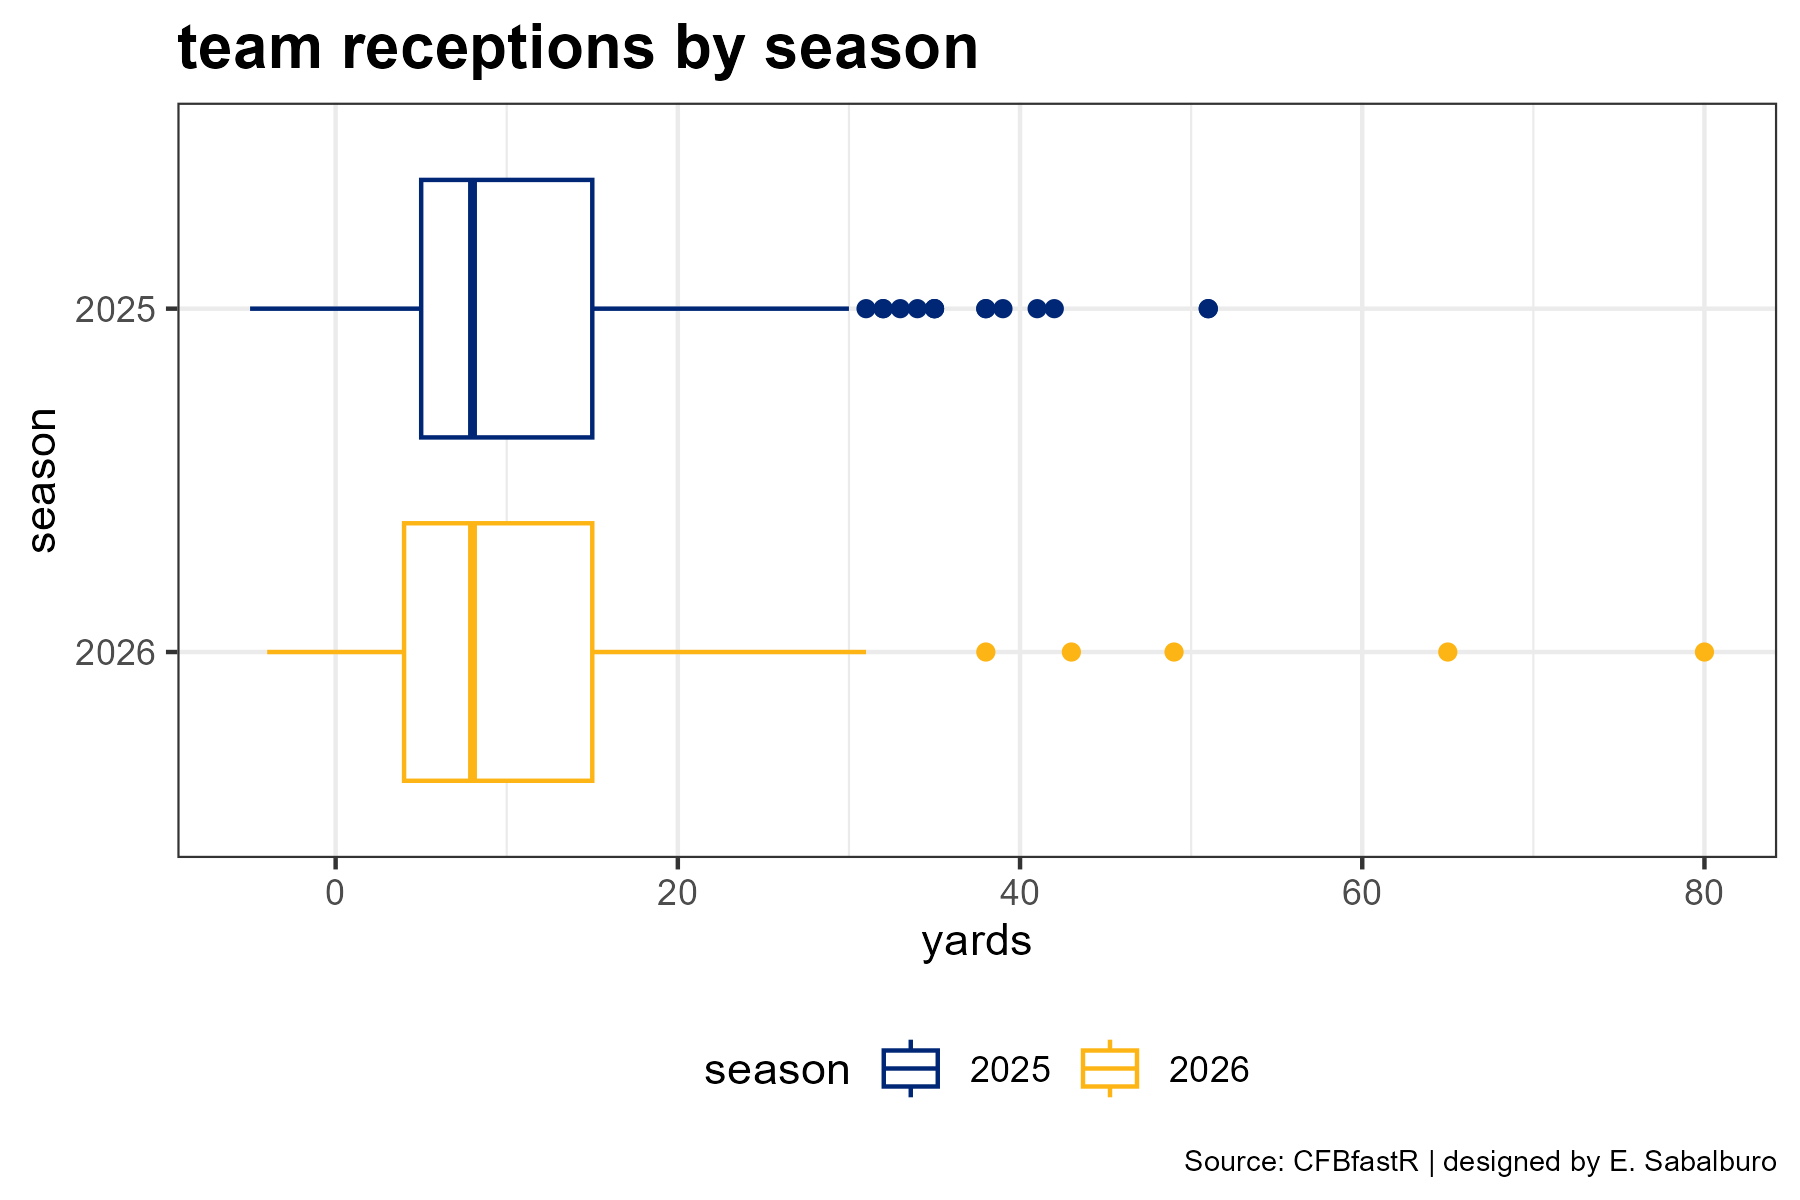
Here’s a box plot summarizing the information for the teams as a whole. Big picture? Among completed passes, the median yards gained matches last year’s, and the spread of those yards doesn’t look too far off either. This is a yellow flag for me. Despite a change in coaching staff, retention of our star QB, and the addition of offensive weapons in the portal, the production of our passing game essentially remains unchanged compared to last year’s season average.
Running
Question: How has the run game looked against each opponent?
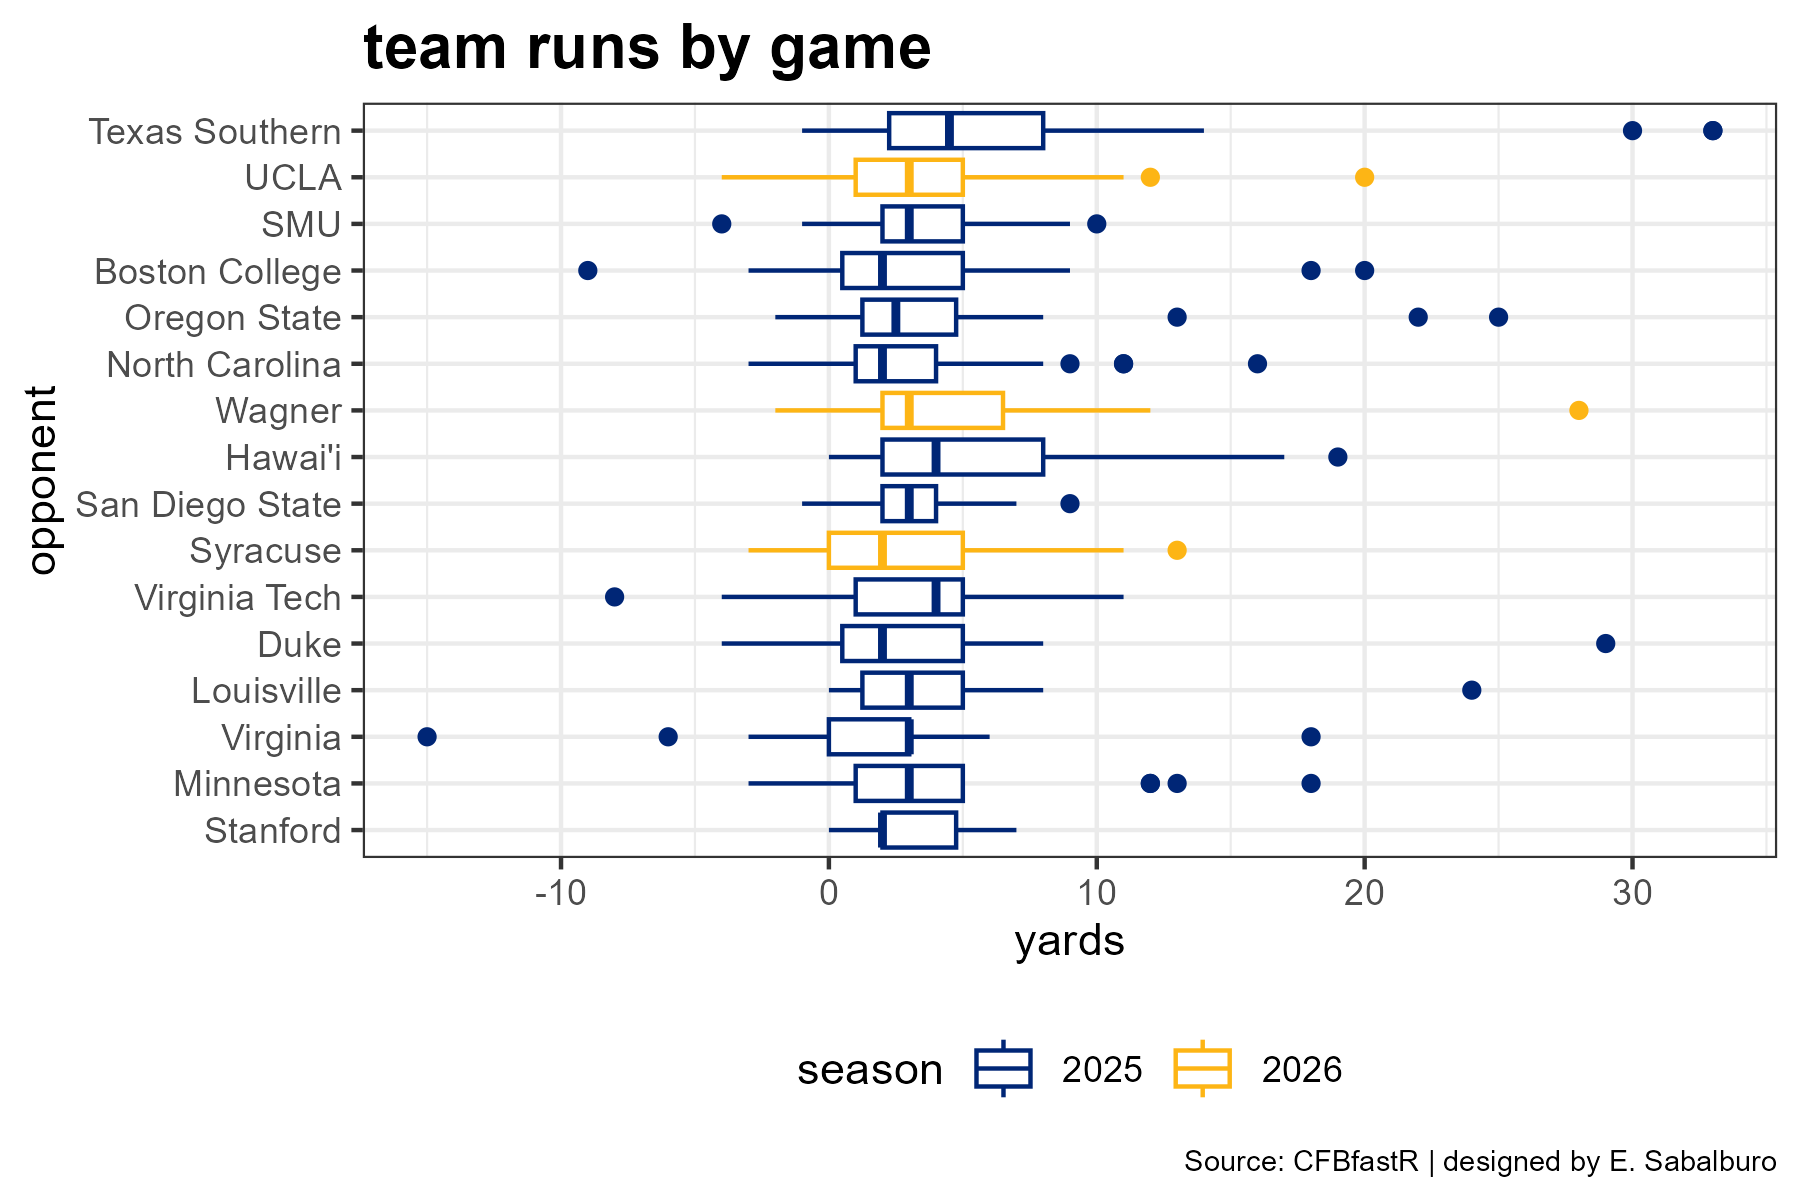
The boxplots here plot runs by game and season. Games with more runs are listed higher up on the graph. As noted above when looking at playcalls, we are running the ball on more plays than we were last year. Is this because we are focusing on establishing the run (to open up the passing game), or because we are insisting on running the ball when we should be throwing it?
Question: How distributed is our run game among rushers?
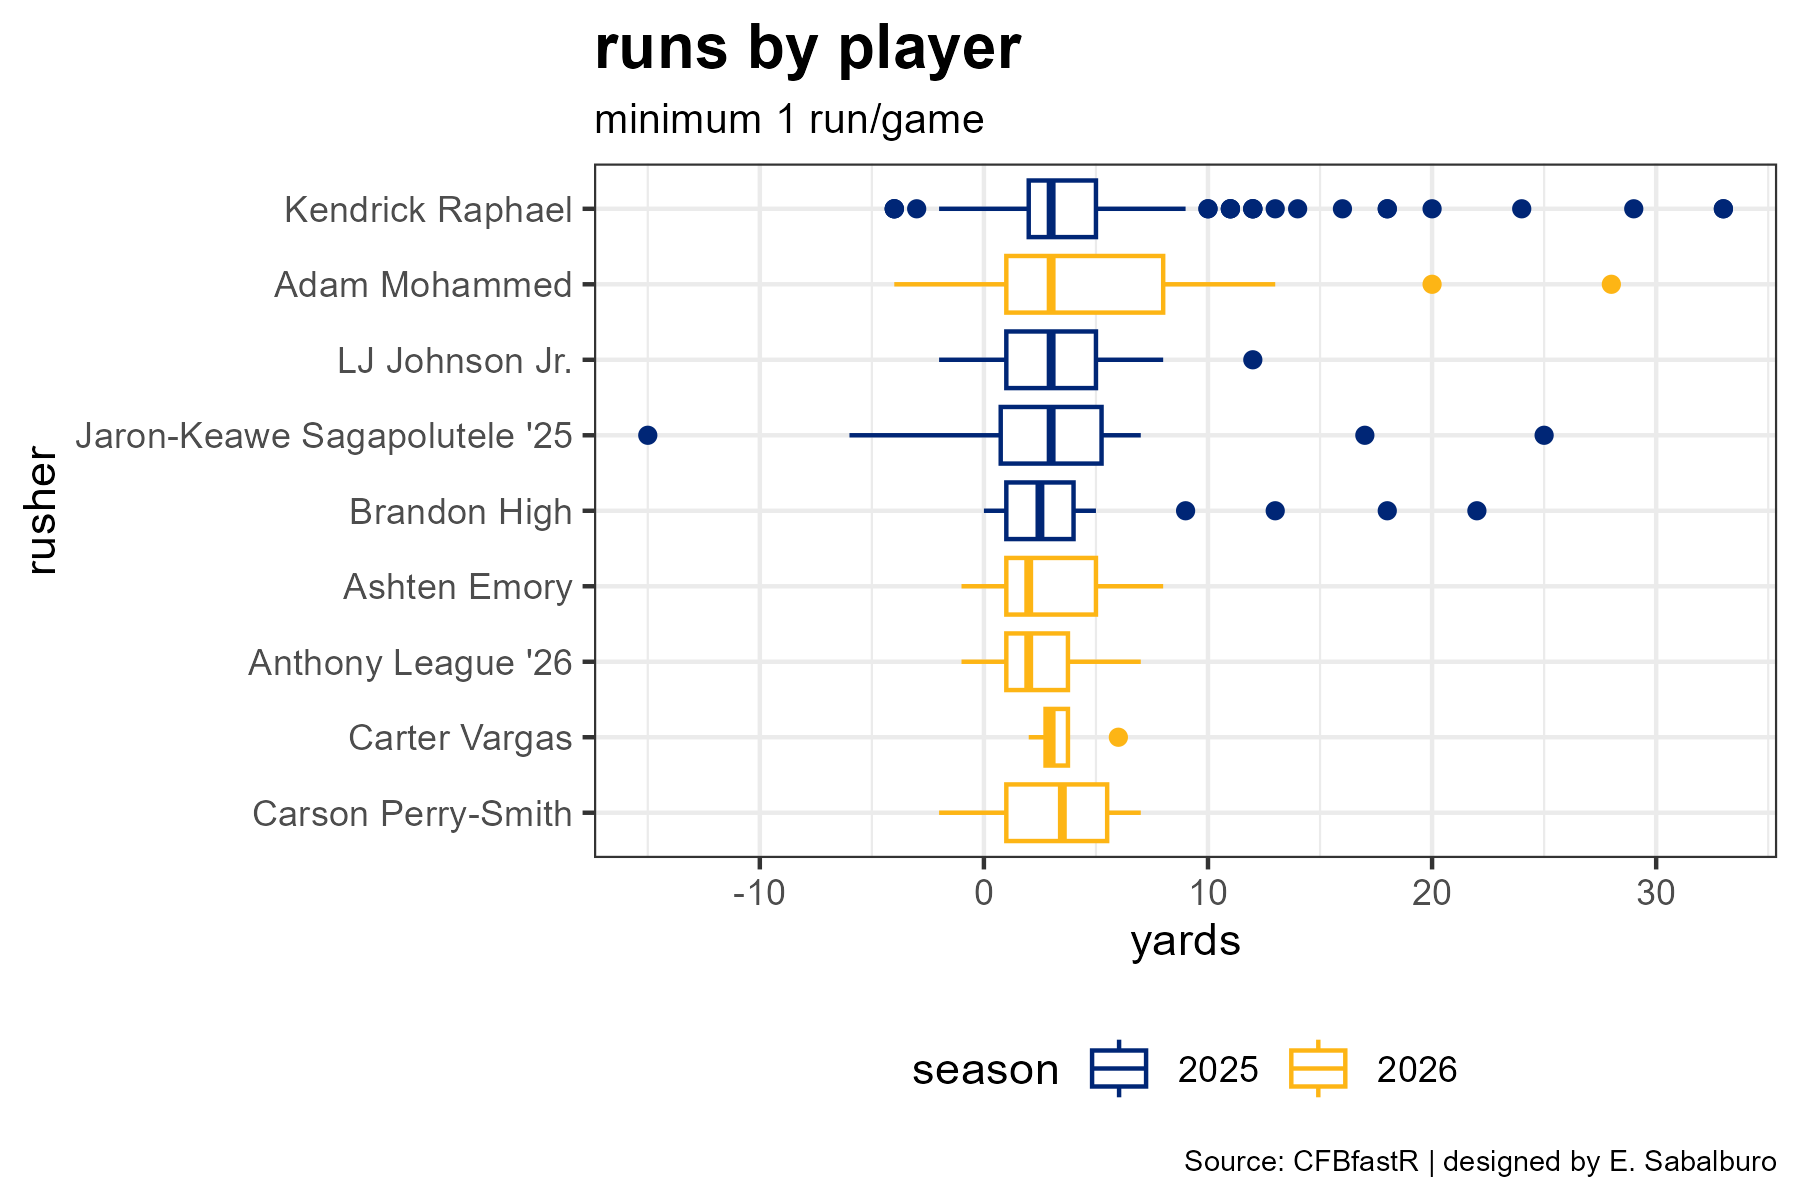
Below I disaggregate the data to show runs by player and season. I only include runners averaging at least one run per game.
Players with more runs per game are listed first. Interestingly, this graph resembles the receiver graph above. With the exception of Adam Mohammed, the 2026 runners are clearly behind the 2025 runners on a per-game basis. Also of note, JKS has not been asked to run the ball this season.
Question: How does the run game compare to last year overall?
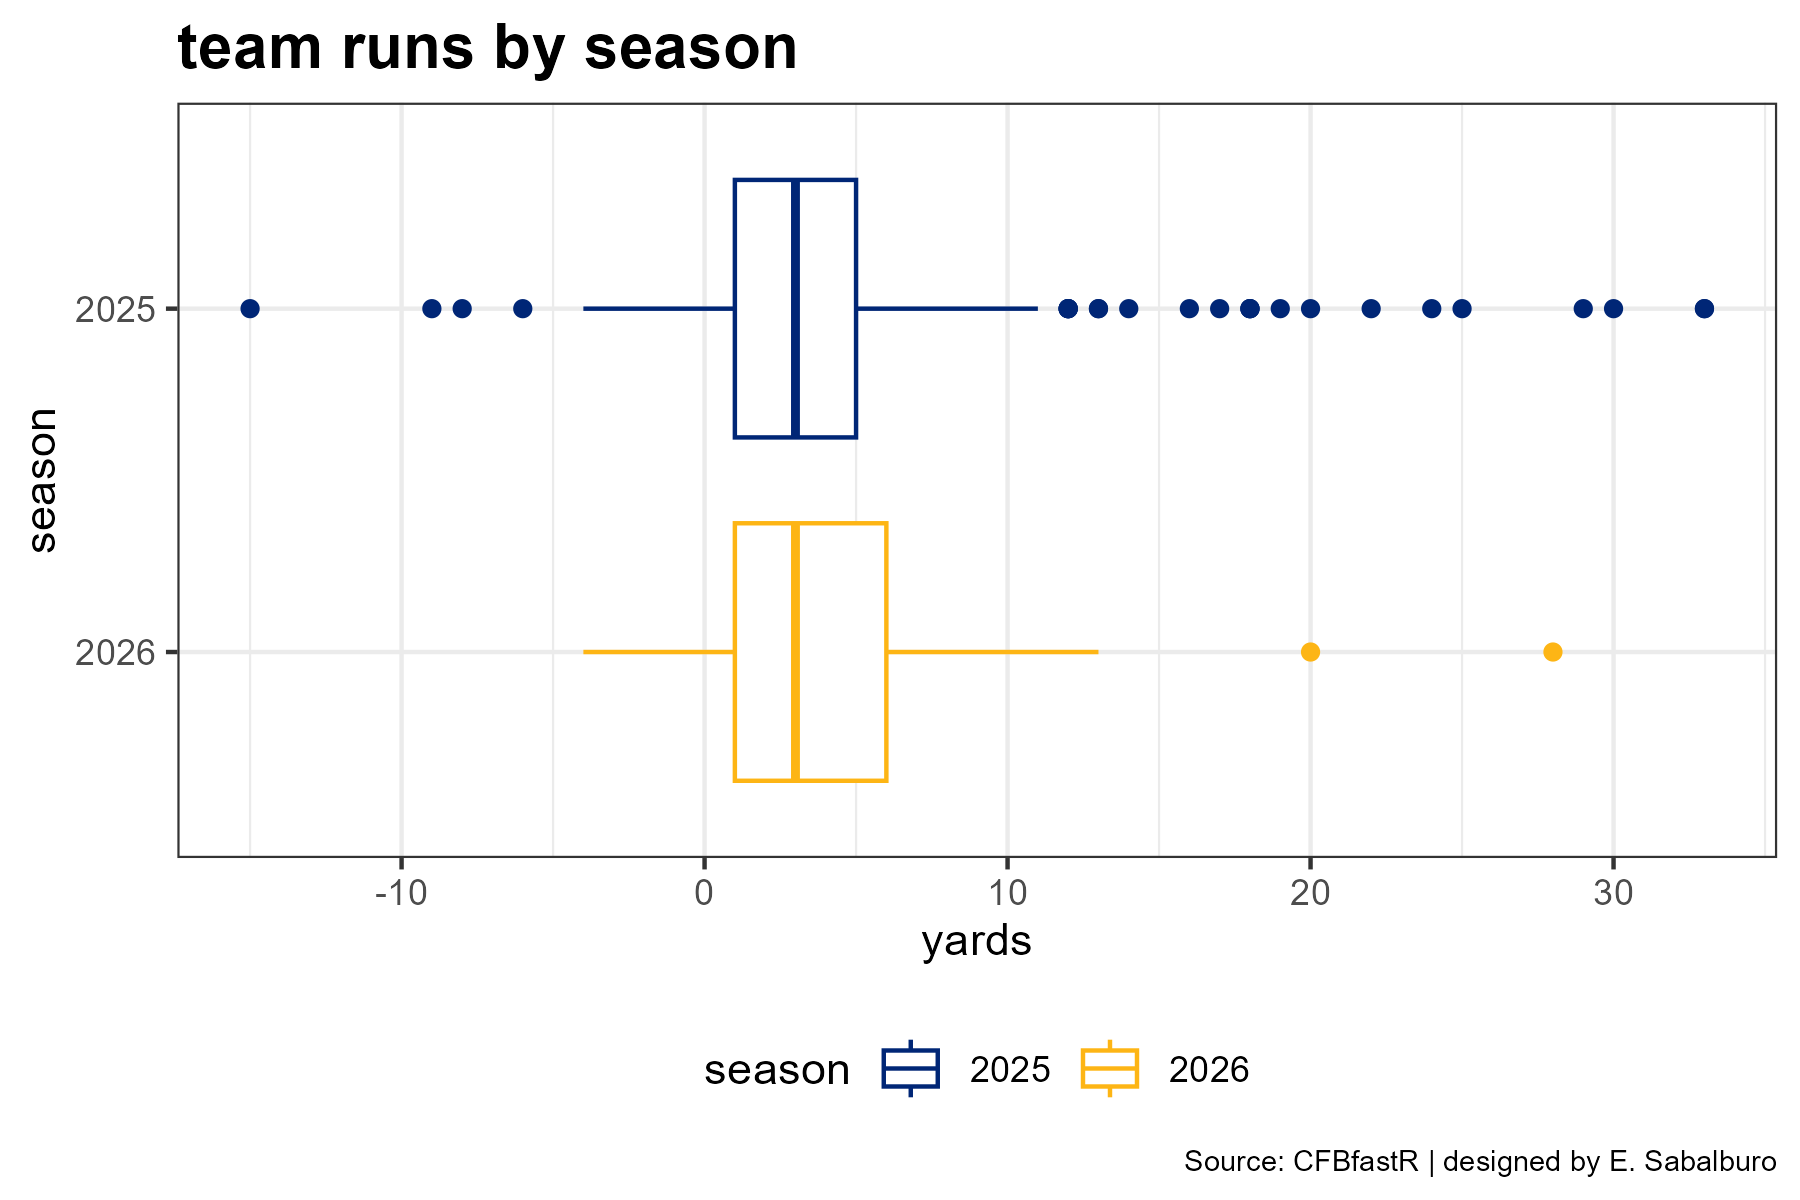
Here’s a box plot summarizing the information for the teams as a whole. Again, an uncanny resemblance to the graph of team receptions. The 2026 team is so far matching the 2025 median yards per run, but with fewer outliers (in both the positive and negative direction). For all the jokes last year about Kendrick Raphael giving us a reliable 3 yards per carry, it seems that the 2026 offense is carrying in that tradition with more reliability.
This is, to be frank, a concern. Most of the runs called through the first three games of 2026 have results in fewer than 5 yards, with more than half of them resulting in fewer than 3. Need I remind you, that one of the games played in 2026 was against Wagner?
Conclusion and Questions
Through three games, the 2026 Golden Bears are, perplexingly, less pass-heavy than in 2025, and I cannot explain why. The California Golden Bears are riding behind a generational arm talent in JKS, but our playcallers have insisted on having our running backs grind out 3 yards per carry.
I hope I am just being overly harsh on a new coaching staff, installing a new offense, with new players. But with a quarter of the season behind us, I hope we see this team adopt an offensive identity that leans into its strengths.
Go Bears.
Really nice work here. The O stats don't show what is common from '25 to '26, which is the same OL personnel. It is clear from your comparative graphs that so far this year the OL is still not creating holes for the RBs, nor protecting JKS effectively. We all hoped the OL personnel would be a year better, but your charts show they are just a year older. That is not harsh, it is reality. Still, GO BEARS!
Why, why do these coaches always waste a play on rocket screens. Never works against a good defense and never catches the defense off guard!