Evans Hall: Not NSYNC Week
Even if it's BYE BYE BYE Week After Wazzu
Go Bearly down the field. There are a lot of issues with the offense especially in trying to convert downs. On the flip side the WSU game revealed a lot of issues in the pass defense on 3rd downs despite having a favorable look for the defense (3rd and long). Let’s look at some data and charts!
Painful Offense Index
There it is, we’re officially a painful offense to watch not just via the eye test but by numbers. We generate too few points for the number of plays we make in a game.
On the flip side, the Cal defense has been keeping opposing offenses nearly in the painful area to watch. The WSU/Arizona games have been moving the Cal logo closer to the regression line and into the confidence interval.
Offense vs. Wazzu
We can see here that the offense’s 2nd down performance fell below the past WSU past outcomes. There is also a big rash of poor passing play on 3rd downs, only 6 1st downs were generated through the air on 2nd and 3rd downs. 2nd down especially being an issue with the running game gaining very few yards if any despite WSU being gettable on 2nd downs.
We can see here from a PPA perspective 2nd down was a very bad down for the offense with 2nd and < 10 being mostly negative outcomes in PPA terms.
Defense vs. Wazzu
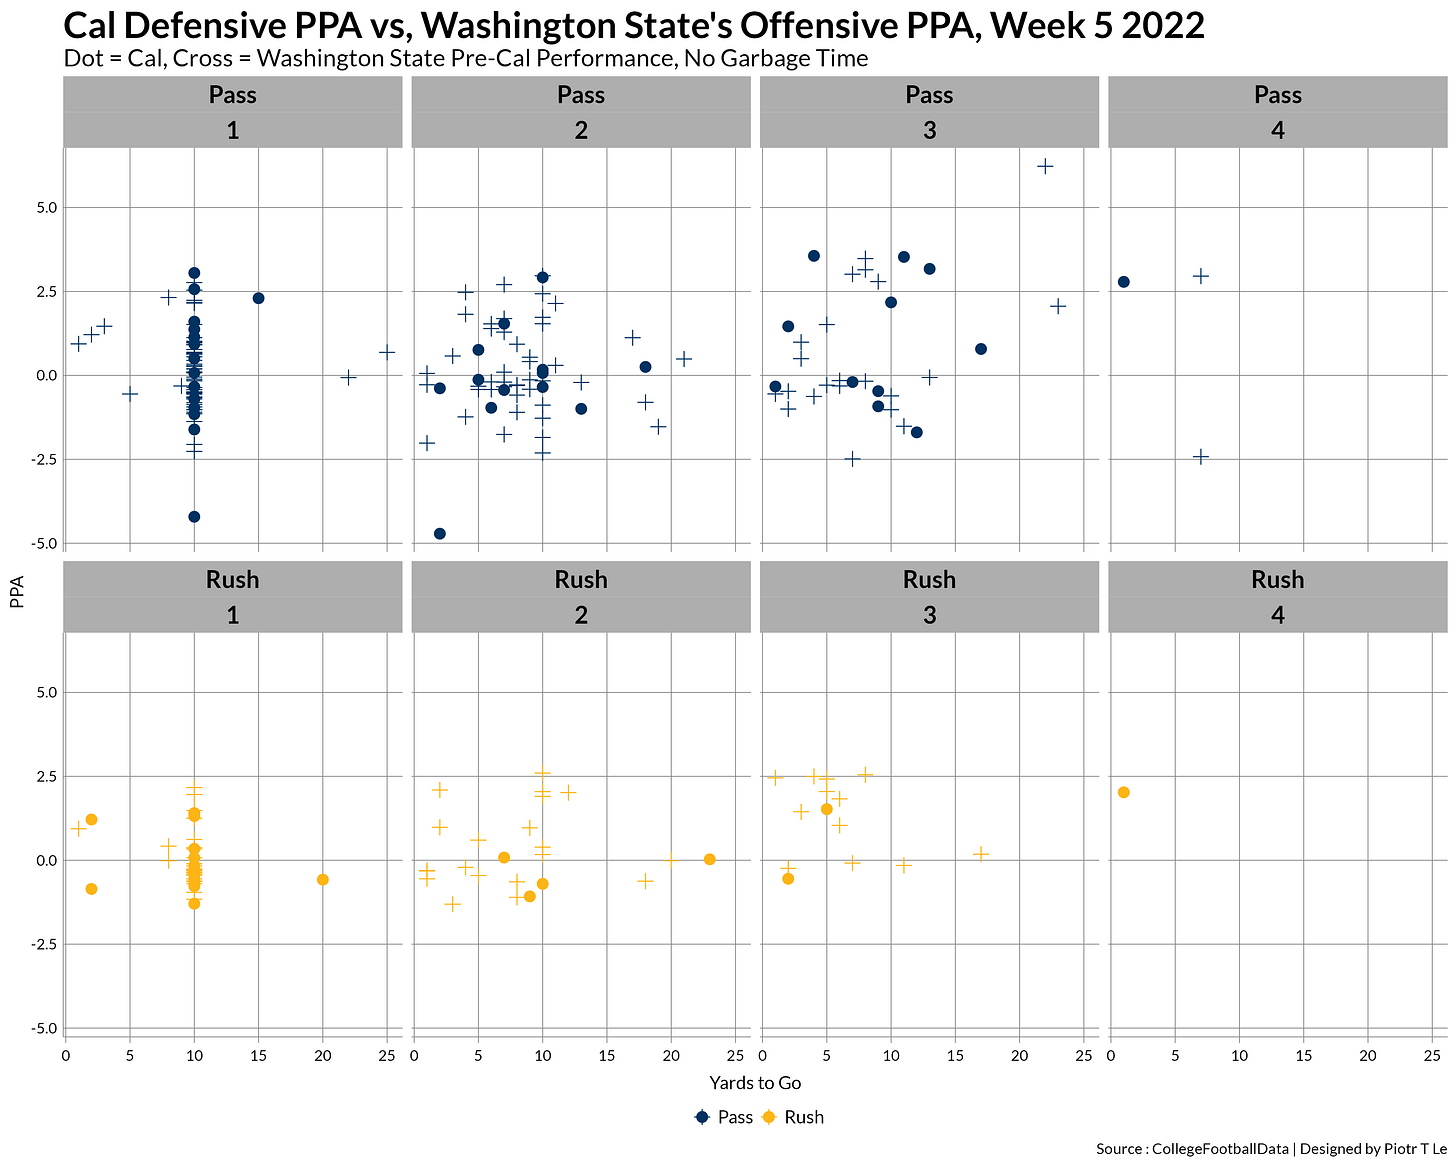
On the other hand WSU dominated the defense on 1st and 3rd downs, especially through the air. WSU’s pass-happy tendencies show themselves on 2nd and 3rd downs. And it was not without cause, note that out of 3rd and >10 to go they were able to convert 3 of 5 cases with 1 case putting WSU on a 4th and ~1 and only 1 resulting in a negative play. This is where the defense failed vs. WSU because they never were able to get conversions before and yet here we are.
Cal really didn’t do well on 3rd down defense against the pass and it shows with several >1 PPA plays Wazzu was able to get on those downs.
Overall PPA Performance
We can see here that Cal continues to struggle on defense in Q3 with both offense and defense taking a step back in Q4. Note where Colorado is at and how poorly they have played in the first 1/3rd of the season.
Here we have us playing right around the national middle on most downs on both sides of the ball with the defense overall being good on 3rd downs vs the rest of the (besides the WSU game). The issue continues to be 2nd down where the defense would trend towards the bottom of P5 while the offense stay bog mediocre.
I think we have stabilized our DSR around the low end of the middle of P5 teams with the TD number being around where it is expected for a team with our DSR.
A big number that declined for Cal is the decrease in the pct. of Yards gained over available. We have fallen below the 50% mark, this re-emphasizes the offense’s issues with getting out of 3 and out situations.
3 and Out Rate vs. TD Rate.
Here it is, the chart depicting the issue with the Cal offense. It is not just that we don’t get TDs, but we’re struggling to get the ball past 10 yards once we gain possession of the ball. we’re in the illustrious company of Kansas State, Boston College, Mizzou, and Iowa. Every time we touch the ball there is a 30% chance that we’re going nowhere fast.
Of course the data is weighed by the 6 3 and outs against ND and 5 against Washington State. Yet, those are the teams that are the closest proxies to the opponents we will face post-Colorado (besides Oregon State and Stanford).
Below is the sequence of plays that lead to those 3 and outs. With the predominant sequence being the dreaded Rush-Rush-Pass sequence.


I really appreciate all the clever ways this site can quantify and visualize just how painful it is to watch the Cal offense.
Hard to come up with a remedy for this. But the problem is the offensive line and play calling. If we did change things up, maybe we would have less 3rd and 8's or 2nd and 10's. I am also not convinced that Plummer is the answer at QB. Does he really give us the best chance to win? He misses on the deep ball most of the time and makes bad passes into the flat. Maybe he doesn't get rattled after taking hits, though last week he was clobbered. I am not saying Millner is better but why not give him a quarter or half to gain some experience. The fact that we have not developed a quarterback in the Wilcox era is very problematic.