Evans Hall: Retrospective on Cal Football Offense, Part 2: Do Androids Dream of Electric Bears?
Data visualization analysis of Cal Football's Offense
Here I will look deeper into the belly of the beast that is Football Statistics and Cal football. I think we’re the only (?) blog out there looking at this data in a detailed manner for 1 non-CFP team, which is fun!
What is not fun is that it is for a 5-7 team that under current inspection isn’t performing up to snuff. There are many process-based reasons for it, however, I won’t explore them just yet.
Notes:
Chase’s completion percentage is a known known so I remove all pass incompletions from the samples to focus on completions to get a look at offensive outcomes.
Point of Consistency: Cal’s inconsistency
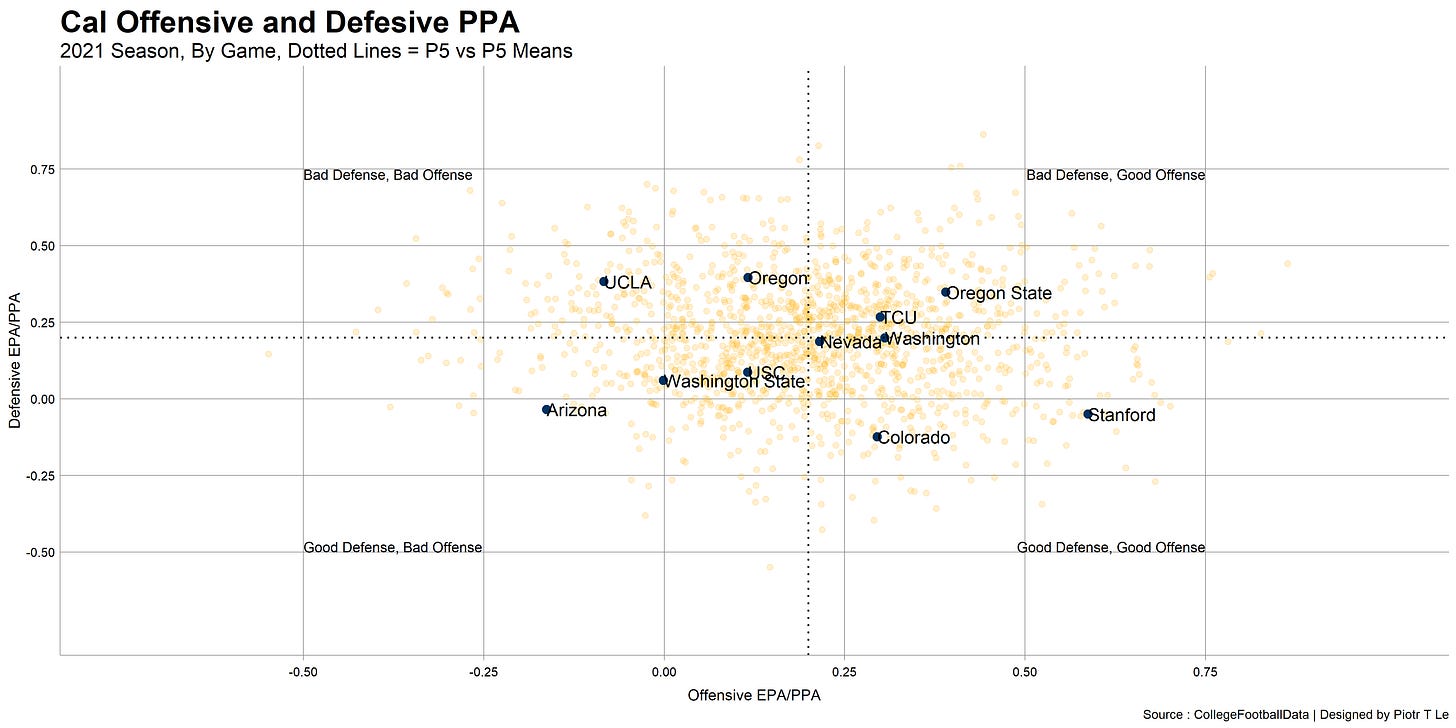
Teams tend to have a certain sense of consistency to them, in this case, we look at Cal’s overall EPA/PPA performance on offense and defense as a starting point by game. We can see here that there is no consistency in Cal football’s play:
6 games had above-average EPA/PPA offense, 6 games had below average
5 games had above-average EPA/PPA defense, 2 had an average defense, and 4 were subpar.
With each quadrant having a good share of games it shows that regardless of week Cal never hit a “stride” that we thought we reached during the season. The best performance of the season was left for the Big Game with the best offensive performance and second-best defensive.
Frequency of Outcomes
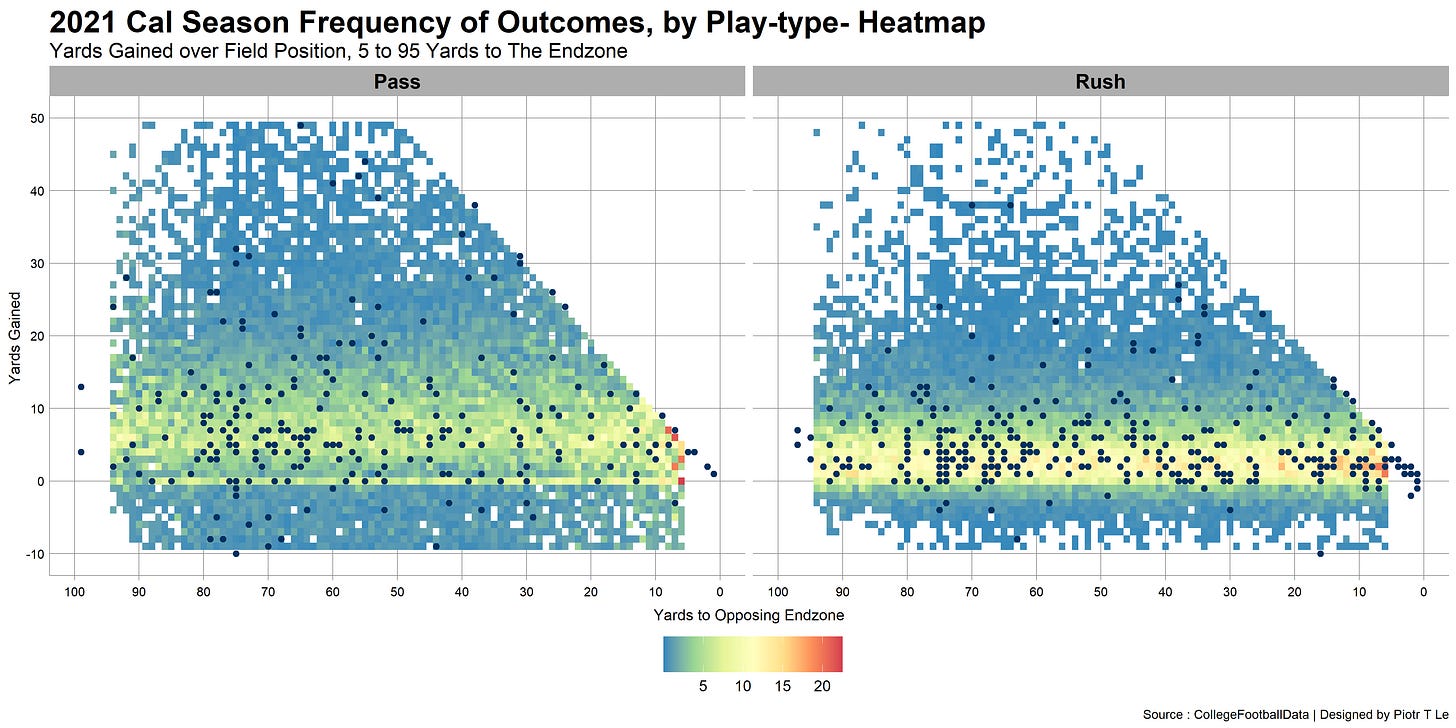
We know from the previous post that Cal was producing statistical averages that are average. But is it because Cal’s outcomes were consistently within the average or is it a product of high variance outcomes?
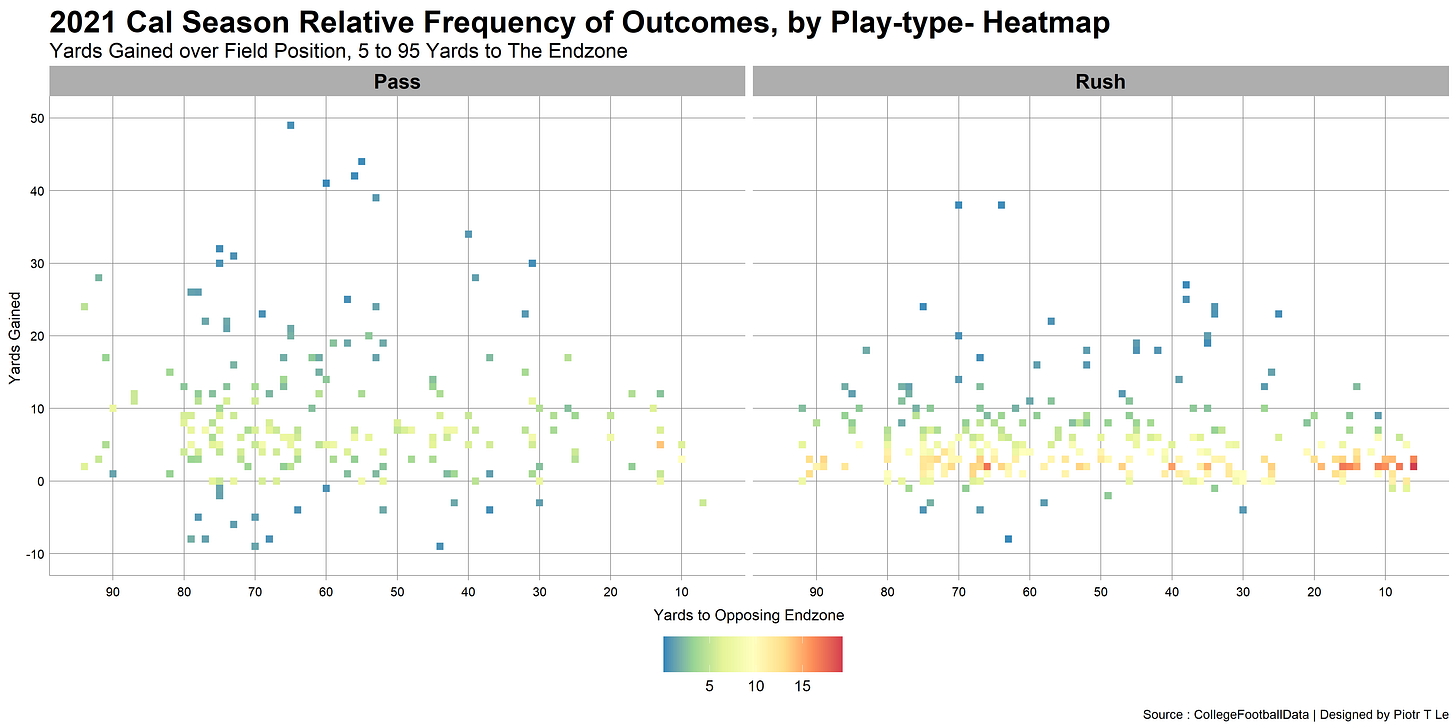
Here we have a heatmap of outcomes as a % of all outcomes for a given distance to the end-zone and playcall, and overlayed on that dots for each Cal offensive outcome for the year. The more frequent the outcomes in CFB the redder the cell gets.
We can see here that we weren’t doing anything out of the median. The smattering of plays in the passing game as well as the running game was about average regardless of position on the field. Which as I mentioned in the last column: an offense loaded with experienced players in the same system should not be producing average outcomes.
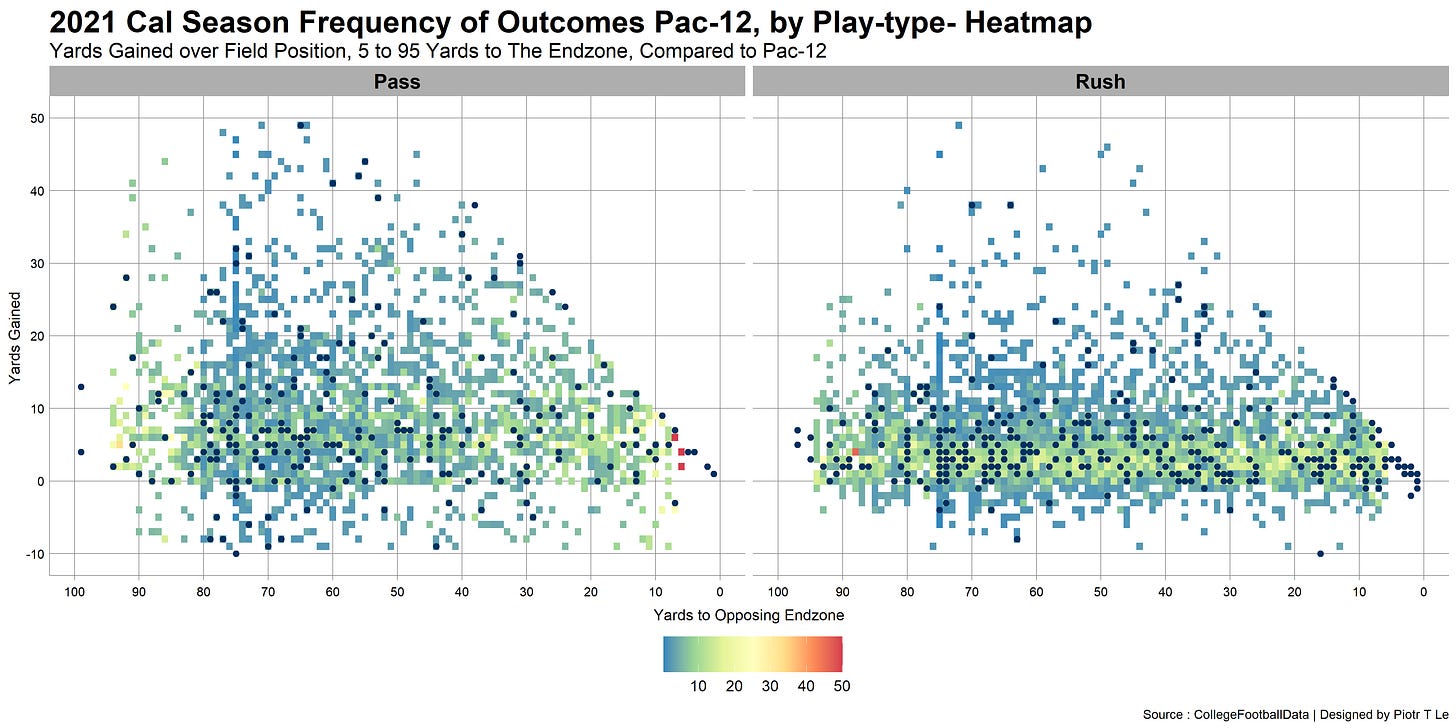
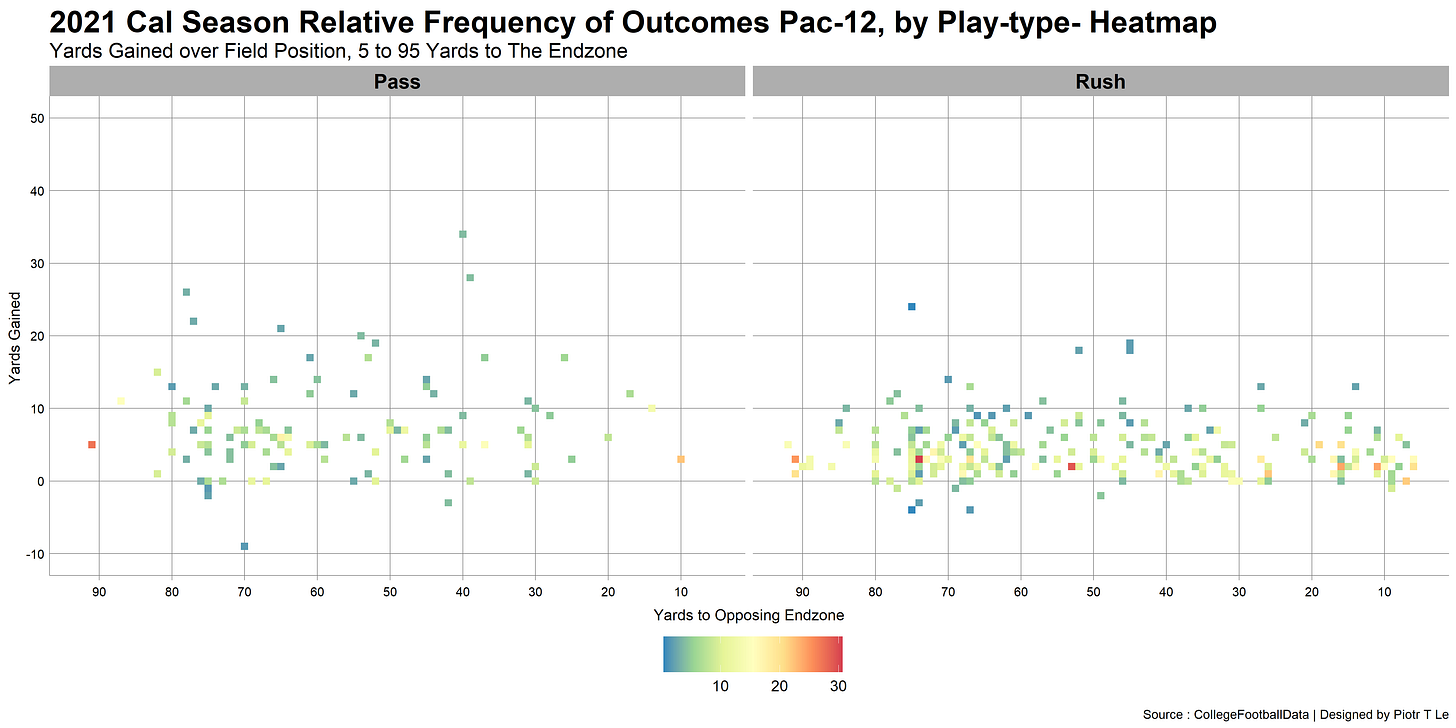
If we focus our comparison to Pac-12 counterparts there are some encouraging signs on the run offense getting some longer plays on the ground, but those are balanced out by the lack of variance in the Cal 25-50 area. Likely means there is a high concentration of runs that didn’t go over 10 yards early in drives. Each dot expresses an instance of a play, however, it does not express the density of outcomes and how common they are vs. the field.
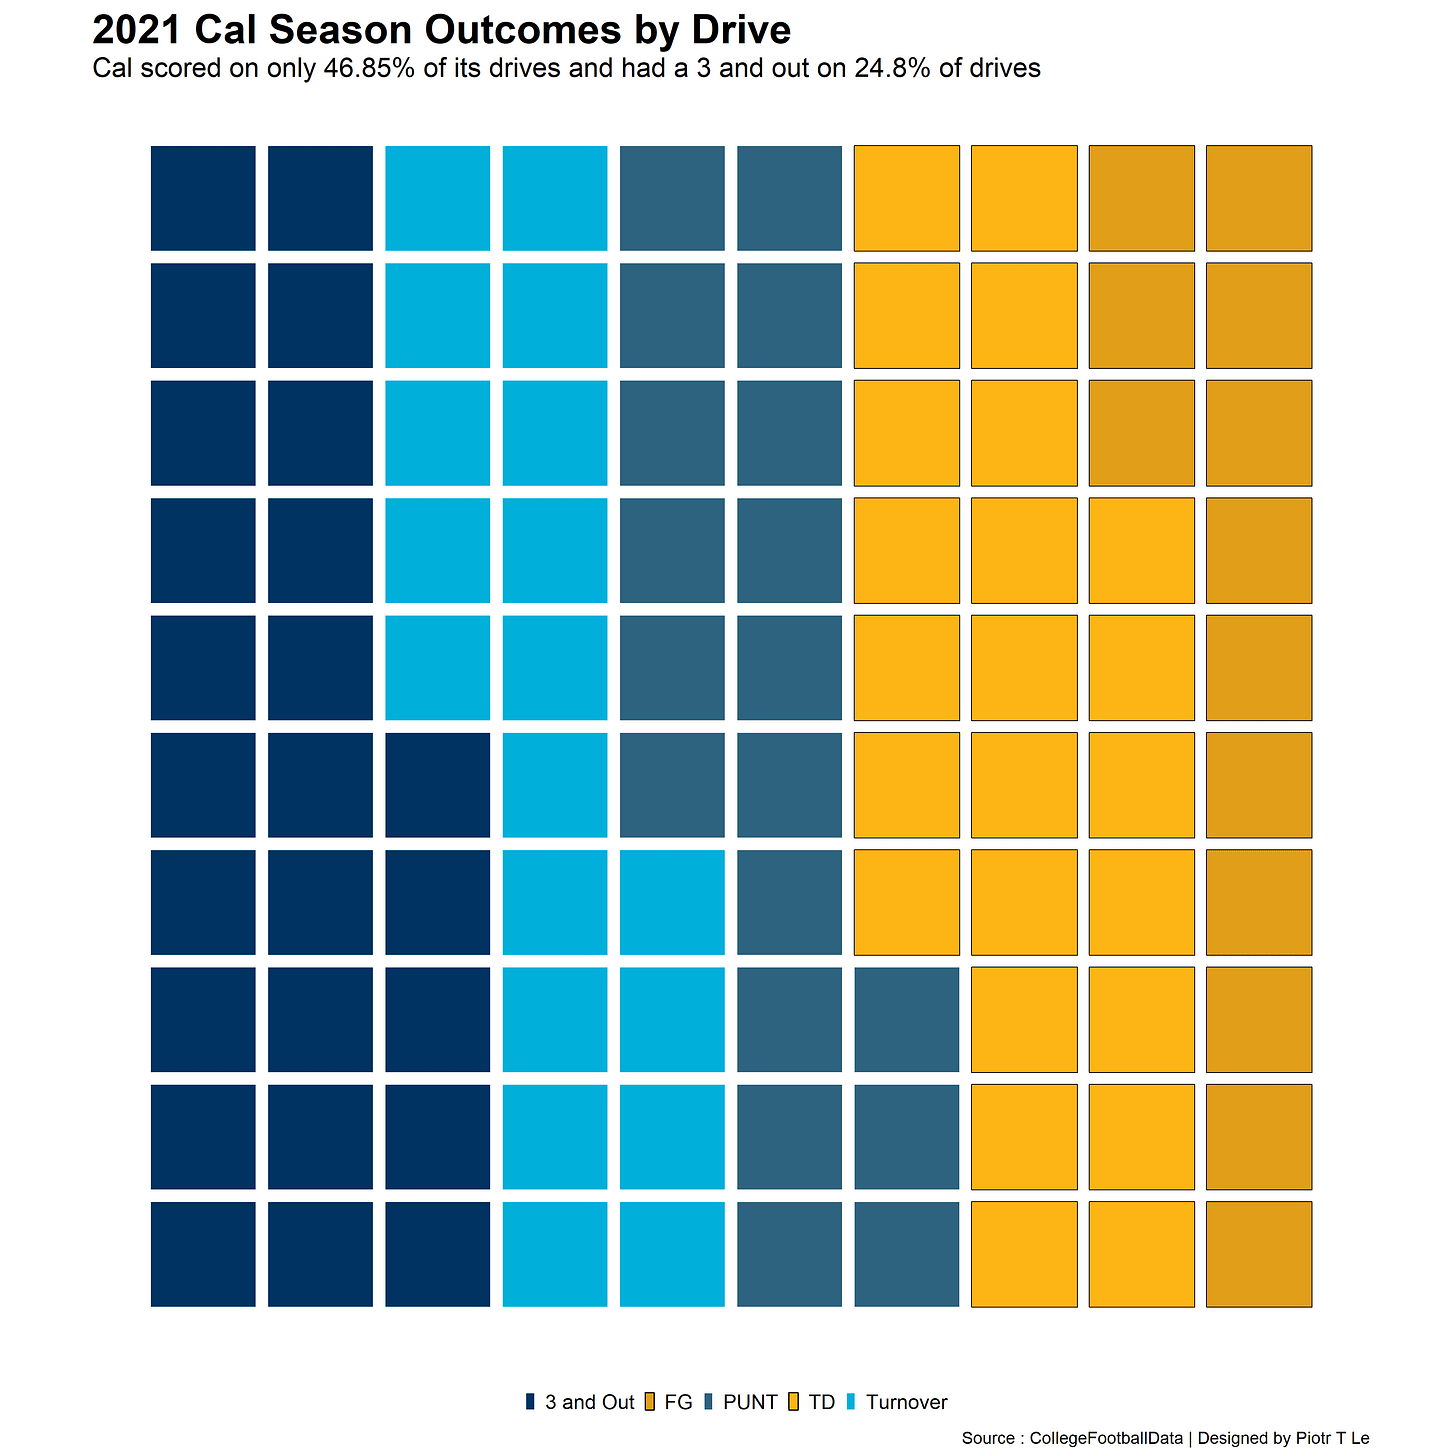
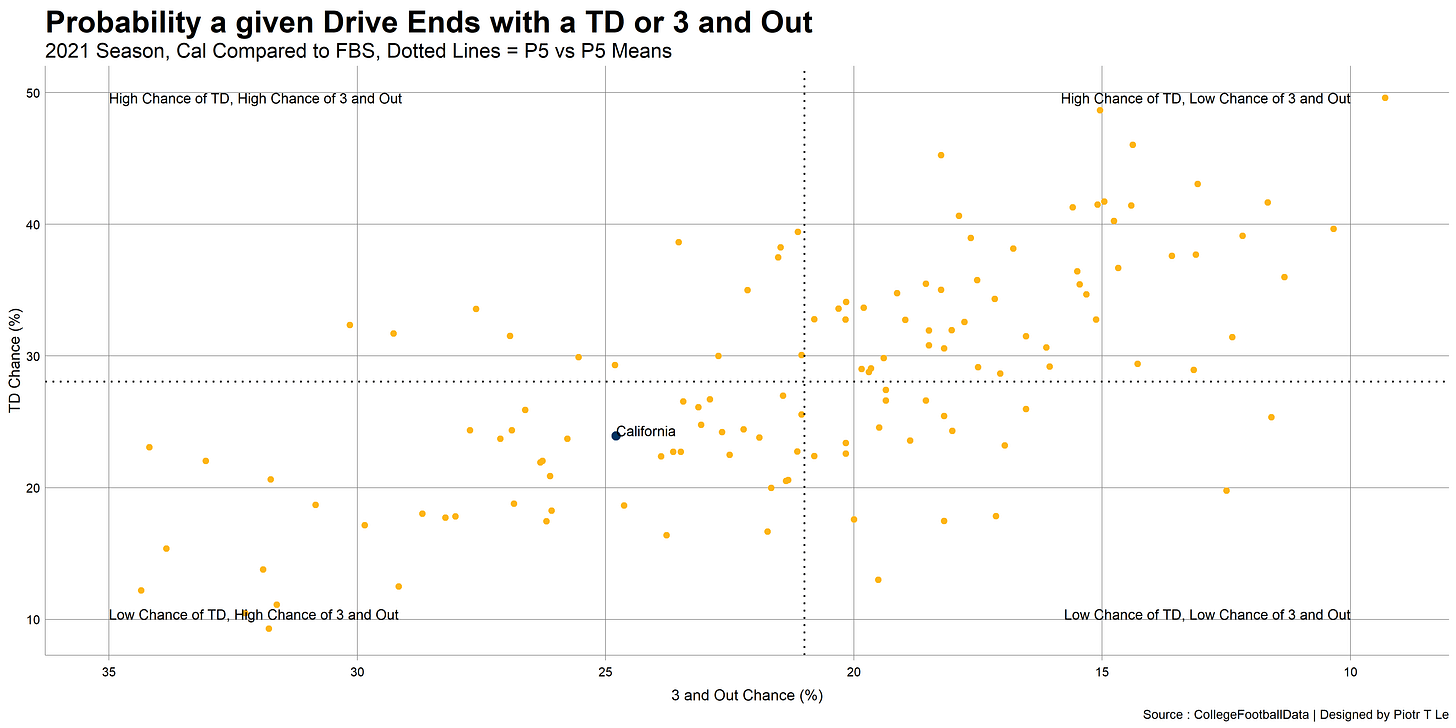
What does that all mean? Looking above you can see the distribution of outcomes by drive. Each drive Cal had faced a 24.8% 3 and out probability, which was the likeliest outcome for the Cal offense at the start of every drive. Nationally it is one of the worst ratios of TD to 3 and out Drives.
We’re on the wrong side of each mean line. With a higher than average chance of a 3 and out and a lower TD chance. That’s not good even if we’re close to the cluster of average teams and if I wanted to I could quantify the difference.
I lied.
We’re barely 1 Standard Deviation below in “3 and Outs” against the mean and ~0.5 Standard Deviations in “TD”. It puts us on the tail end of the (assumed standard distribution) of the mediocre team in FBS on offense.
Relative Mediocrity
Here we can see the relative outcome differences, the redder the tile the more frequently Cal achieved a given outcome on that part of the field. We can see here that vis-a-vis the field, Cal was more likely to get 0-10 yards on a play (~10-15 percentage points more likely to gain 0-10 yards on a given play ) than the rest but it was sorely lacking in anything 10-20 and especially 20-30 yard gains (lack of tiles and them being blue). The issue with gaining 10-20 yards is even more prevalent in the run game where we had a higher probability of getting 0-5 yards than the CFB field but anything more was much less likely.
Even if we shrink the comparison to just Pac-12 offenses, the lack of explosive plays on the ground is even more striking. We were operating squarely before the sticks and not converting often enough on the ground. However, the passing game was also not producing, leading to laborious drives that could stall out at any sign of loss of yards/downs setback.
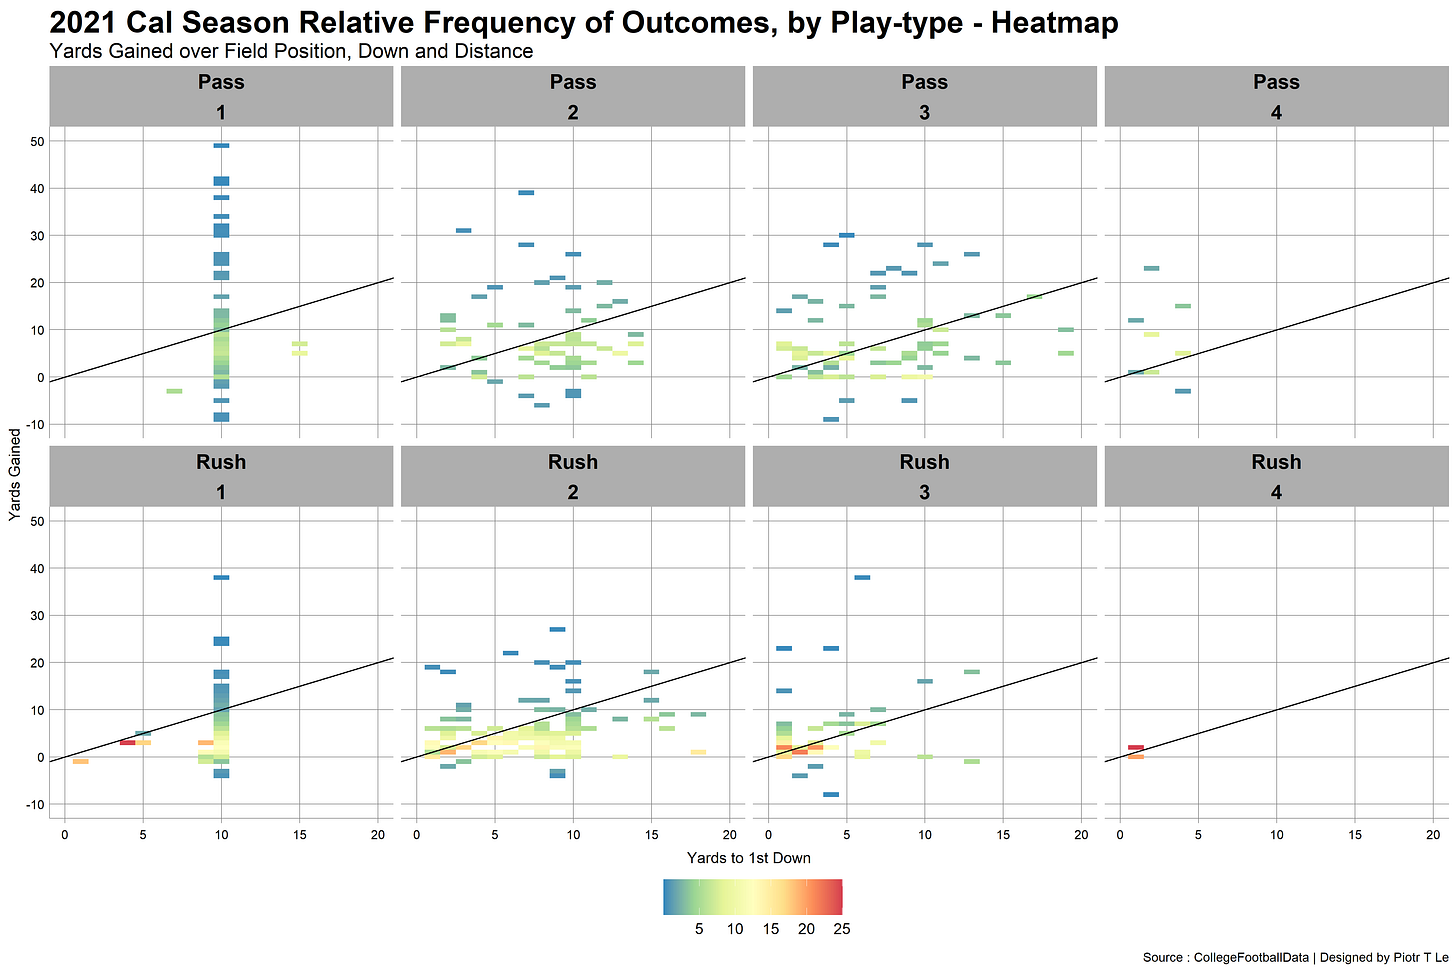
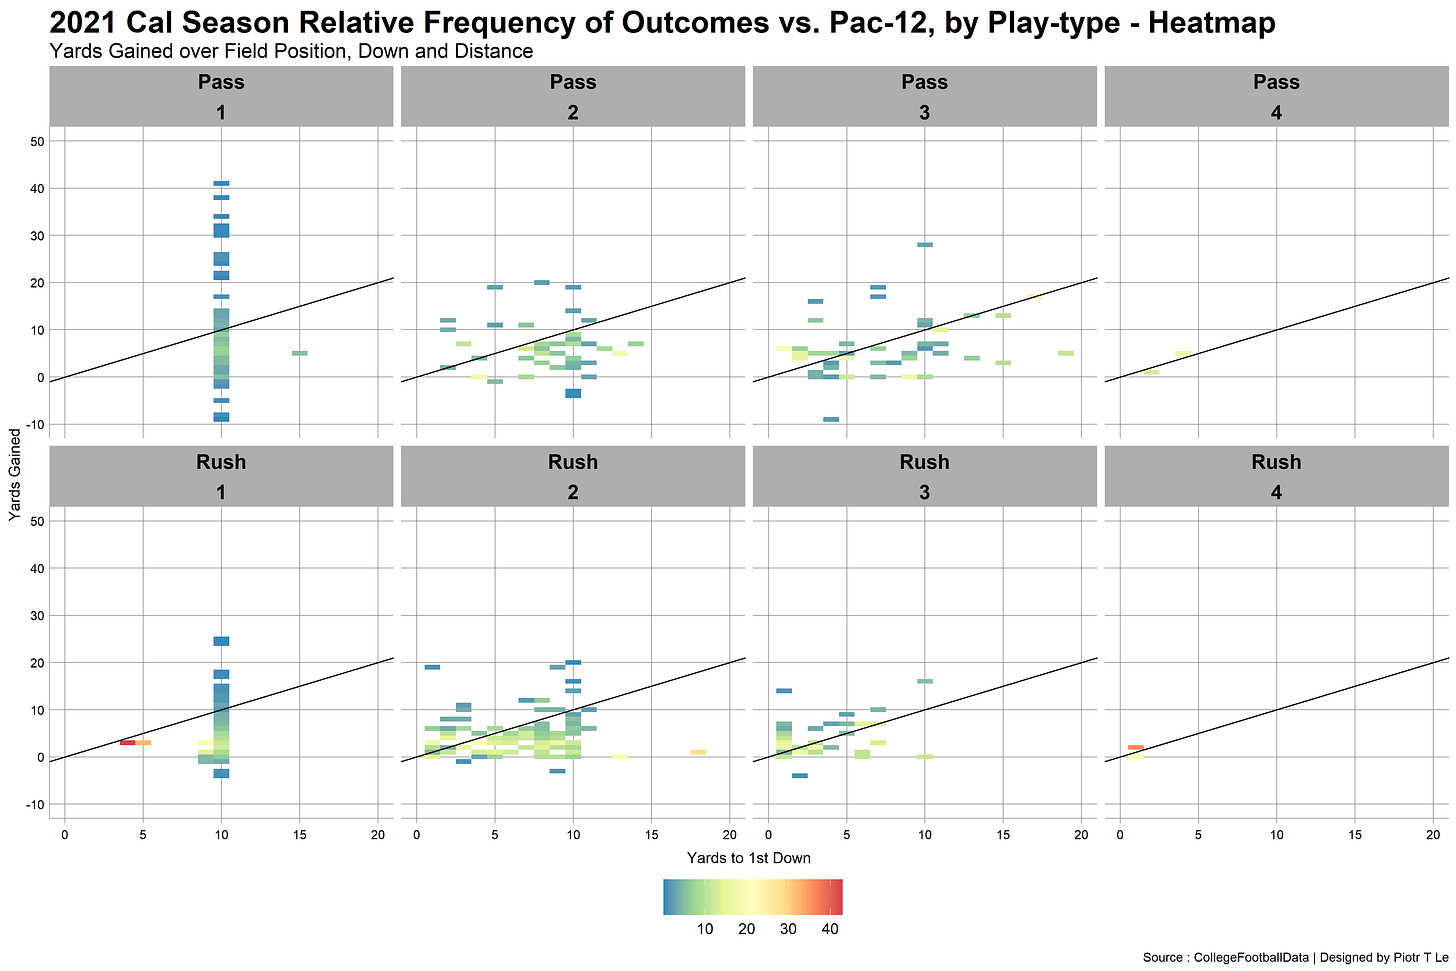
Let’s break it down by down and distance. The line splits each chart into outcomes that gained a 1st down (on and above), and outcomes that did not (below the line). This again showcases the lack of effective outcomes (10-20 yard gains) that would make the offense feel like they were moving down the field with ease, rather than have to keep getting into 3rd down situations.
These outcomes aren’t a product of a harder or more complex schedule of defenses faced. Even if we boil it down to a sample Pac-12 teams that faced similar schedules and opponents Cal’s outcomes are 10-15 percentage points more likely than the Pac-12 trends to not gain a 1st down. The most worrying issue is that despite having 2nd and <5 looks neither the run game or pass game could produce more than 20 yards.
Touchdown Locations
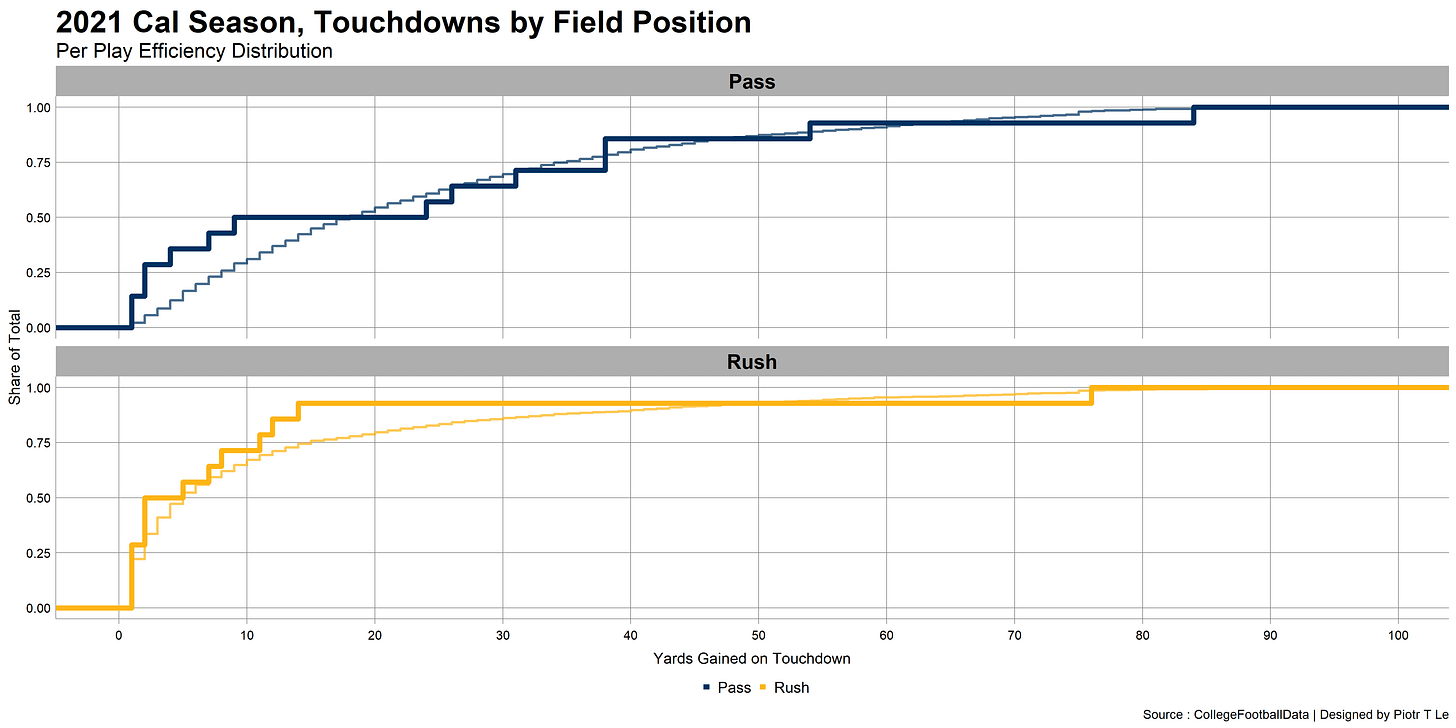
Compared with the rest of the nation half of the TDs for the Cal passing offense came from the 10 yards or closer outpacing the share of the national performance. The issue with the offense not being able to score TDs from 10-20 yard ranges puts more strain on the offense to convert another 1st down in an already lumbering offense. The lack of explosive rushing touchdowns is also highlighted with all but 1 TD scored from <15 yard ranges.
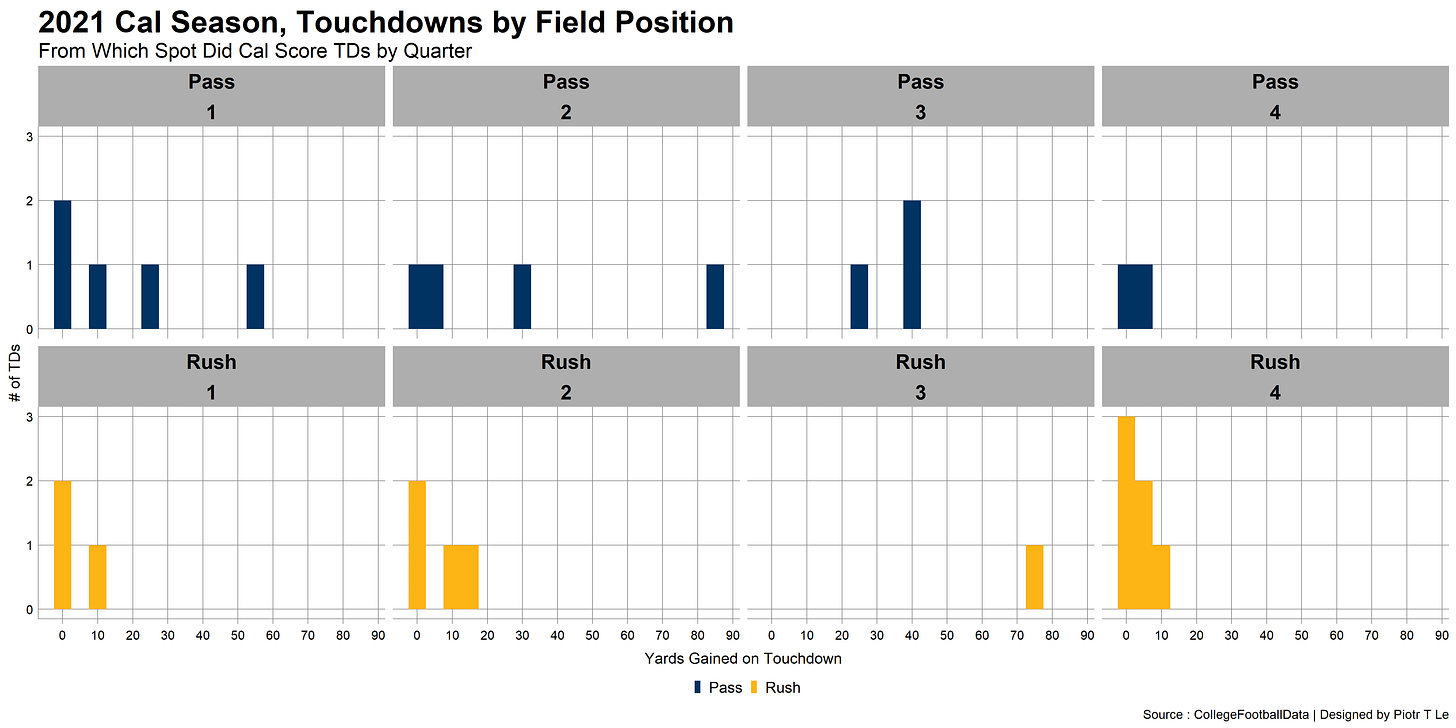
Here we can see the distribution of the TDs by quarter and location, just for Cal. We can see here the issue: in Q3, Cal was unable to score TDs to keep pace with the earlier game performance. With the 1 big play TD by Dancy against Stanford there were no rushing TDs, with the 3 of the passing TDs coming against Oregon State and Colorado (hardly defenses to write home about). Even in the Q4 where the rushing offense was able to score TDs the passing offense only scored 2 TDs.
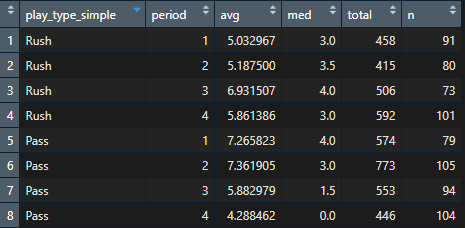
Here are the period and play-type specific outcomes by looking at yards: average, median, total yards gained, and # instances (n). We can see here the big difference in the 1st and 2nd half outcomes for the passing offense that kept declining in output from a very good 7.3 YPA to a measly 4.3 YPA with a median of 0 ie. more than half of the plays were <= 0 yards.
The running game gained steam in Q3 and had some momentum left in Q4. However, Christopher Brooks Jr’s 75-yard run and Marcel Dancy’s 76-yard TD in the Stanford game skew the observations, removing those two the average goes down to still respectable 5.95 (423 yards on 71 attempts).
However, as we noted before Cal is at its heart a passing offense, an offense that didn’t adjust to the defenses’ adjustments to the passing game and didn’t lean on the run game that looked to heat up. Even if the averages were the same with the medians for the run being double of passing offense’s there was an opportunity to run the ball more but the offense went even more pass-heavy with a 94/73 split.
Review
We can see here that the offense was an average offense on a play-by-play basis that avoided negative plays but lacked any ability to produce effective yardage making each drive feel like watching a man struggle with a puddle of molasses. Add in an offense that has half of its passing TDs and nearly all of its rushing TDs within the opponent's 10 yard area.
Though it is a truism of the football world to have most TDs come in the red-zone (50% passing and 80% of all rushing TDs in 2021 for all FBS), however, unlike the rest of the field Cal was unable to produce scores outside of the 10 yard area in front of the opponent endzone.
The emphasis on the pass and lack of adjustment coming out of halftime is an explanation for the scoring droughts in Q3 and Q4, especially on the passing offense front.
What this leads to is a nationally sub-average offense both in aggregate terms (points et al.) and in efficiency-based terms.


The lack of explosiveness under Wilcox is such a huge problem. Cal cannot expect to compete for a Pac-12 title if we can't generate chunk plays. We had so many 8 play, 50 yard drives end in 0 or 3 points because we can't finish drives or we just run out of momentum because it's hard to sustain an offense all the way down the field on 0-10 yard plays.
So the offense basically sucked last year, as it has every year under the Wilcox era. And that was with all those seniors manning the skill positions and Garbers scrambling from the pocket that kept a lot of drives going. Imagine how it's going to be next year with a ton of inexperience and perhaps a quarterback who is not as mobile as Garbers. (If it's Plummer, he didn't run much at all at Purdue). Ooops, I forgot....Our head coach turned down the Oregon job. Everything is going to be A okay.