

Welcome back to The Good, the Bad, and the Rockfights, our weekly statistical exercise in trying to categorize the previous weekend’s performance. This week’s analysis feels like overkill, in the same way that using a graphing calculator to calculate 1+1 feels like overkill. We all know what the results of this week’s analysis are going to be. If we get another game like this next week, I’m using an abacus to calculate the results.
Glossary
Want to know what kinds of Cal football games we’re currently identifying or how to read the Good-Bad-Rockfight-Pillowfight chart? This section should answer any questions you have about the plots and analysis. Otherwise, skip ahead to the plots.
Types of Cal football games
Good: Cal moves the ball productively and efficiently, and turns possessions into points. Meanwhile the defense stops the opponent’s drives early and prevents scoring opportunities.
Bad: The opposite of The Good: Cal can’t move the ball well or efficiently and cannot turn possessions into points. Meanwhile the defense surrenders many yards, long plays, and points.
Rockfight: These are led by strong defensive performances where the defense forces the opponent to grind out inefficient drives that usually end in a punt or turnover. Meanwhile, the offense replicates that struggle. These games are usually dictated by the rule of 21: first team to score 21 wins.
Pillowfight: both offenses can do whatever they want while the defenses are powerless to stop them. These are high-scoring shootouts that are usually decided in the waning minutes of the 4th quarter.
Plots
Boxplots: a boxplot illustrates the spread of data points. The plots used in this series highlight the most recent game’s rating in gold while the remainder of the data points are represented in the boxplot. The box captures data between the 25th and 75th percentiles while the horizontal line represents the median, or midpoint of the data. tl;dr: above the box = great, above the line = good, below the line = bad, below the box = turrible.
Cluster diagram: this illustrates our Good, Bad, Rockfights, and Pillowfights clusters. Each data point represents a game, and points closer together received more similar ratings while points farther apart received more dissimilar ratings. We use a k-means clustering algorithm to organize the games into four distinct clusters, which are color-coded in the plot.
BCF Toys Ratings
(the same ratings are used for offense and defense, so I will only define them once)
Game Rating (GR): opponent-adjusted FEI offense rating, capturing the expected scoring advantage the offense had against the opposing defense (and vice versa, for the defensive rating)
Efficiency (Eff): same as Game Rating, but the scoring advantage against an average defense
Points per Drive (PPD): points per drive during regulation, non-garbage time possessions (or opponent’s PPD, for the defensive rating)
Success Rate (SR): percentage of non-garbage time drives ending in a TD or FG attempt
Yards per Play (YPP): yards per play on non-garbage time possessions
Available Yards (AYd): the distance covered on a drive divided by the distance to the end zone when the drive began for non-garbage time possessions (basically, the proportion of the field covered during a possession)
Offense
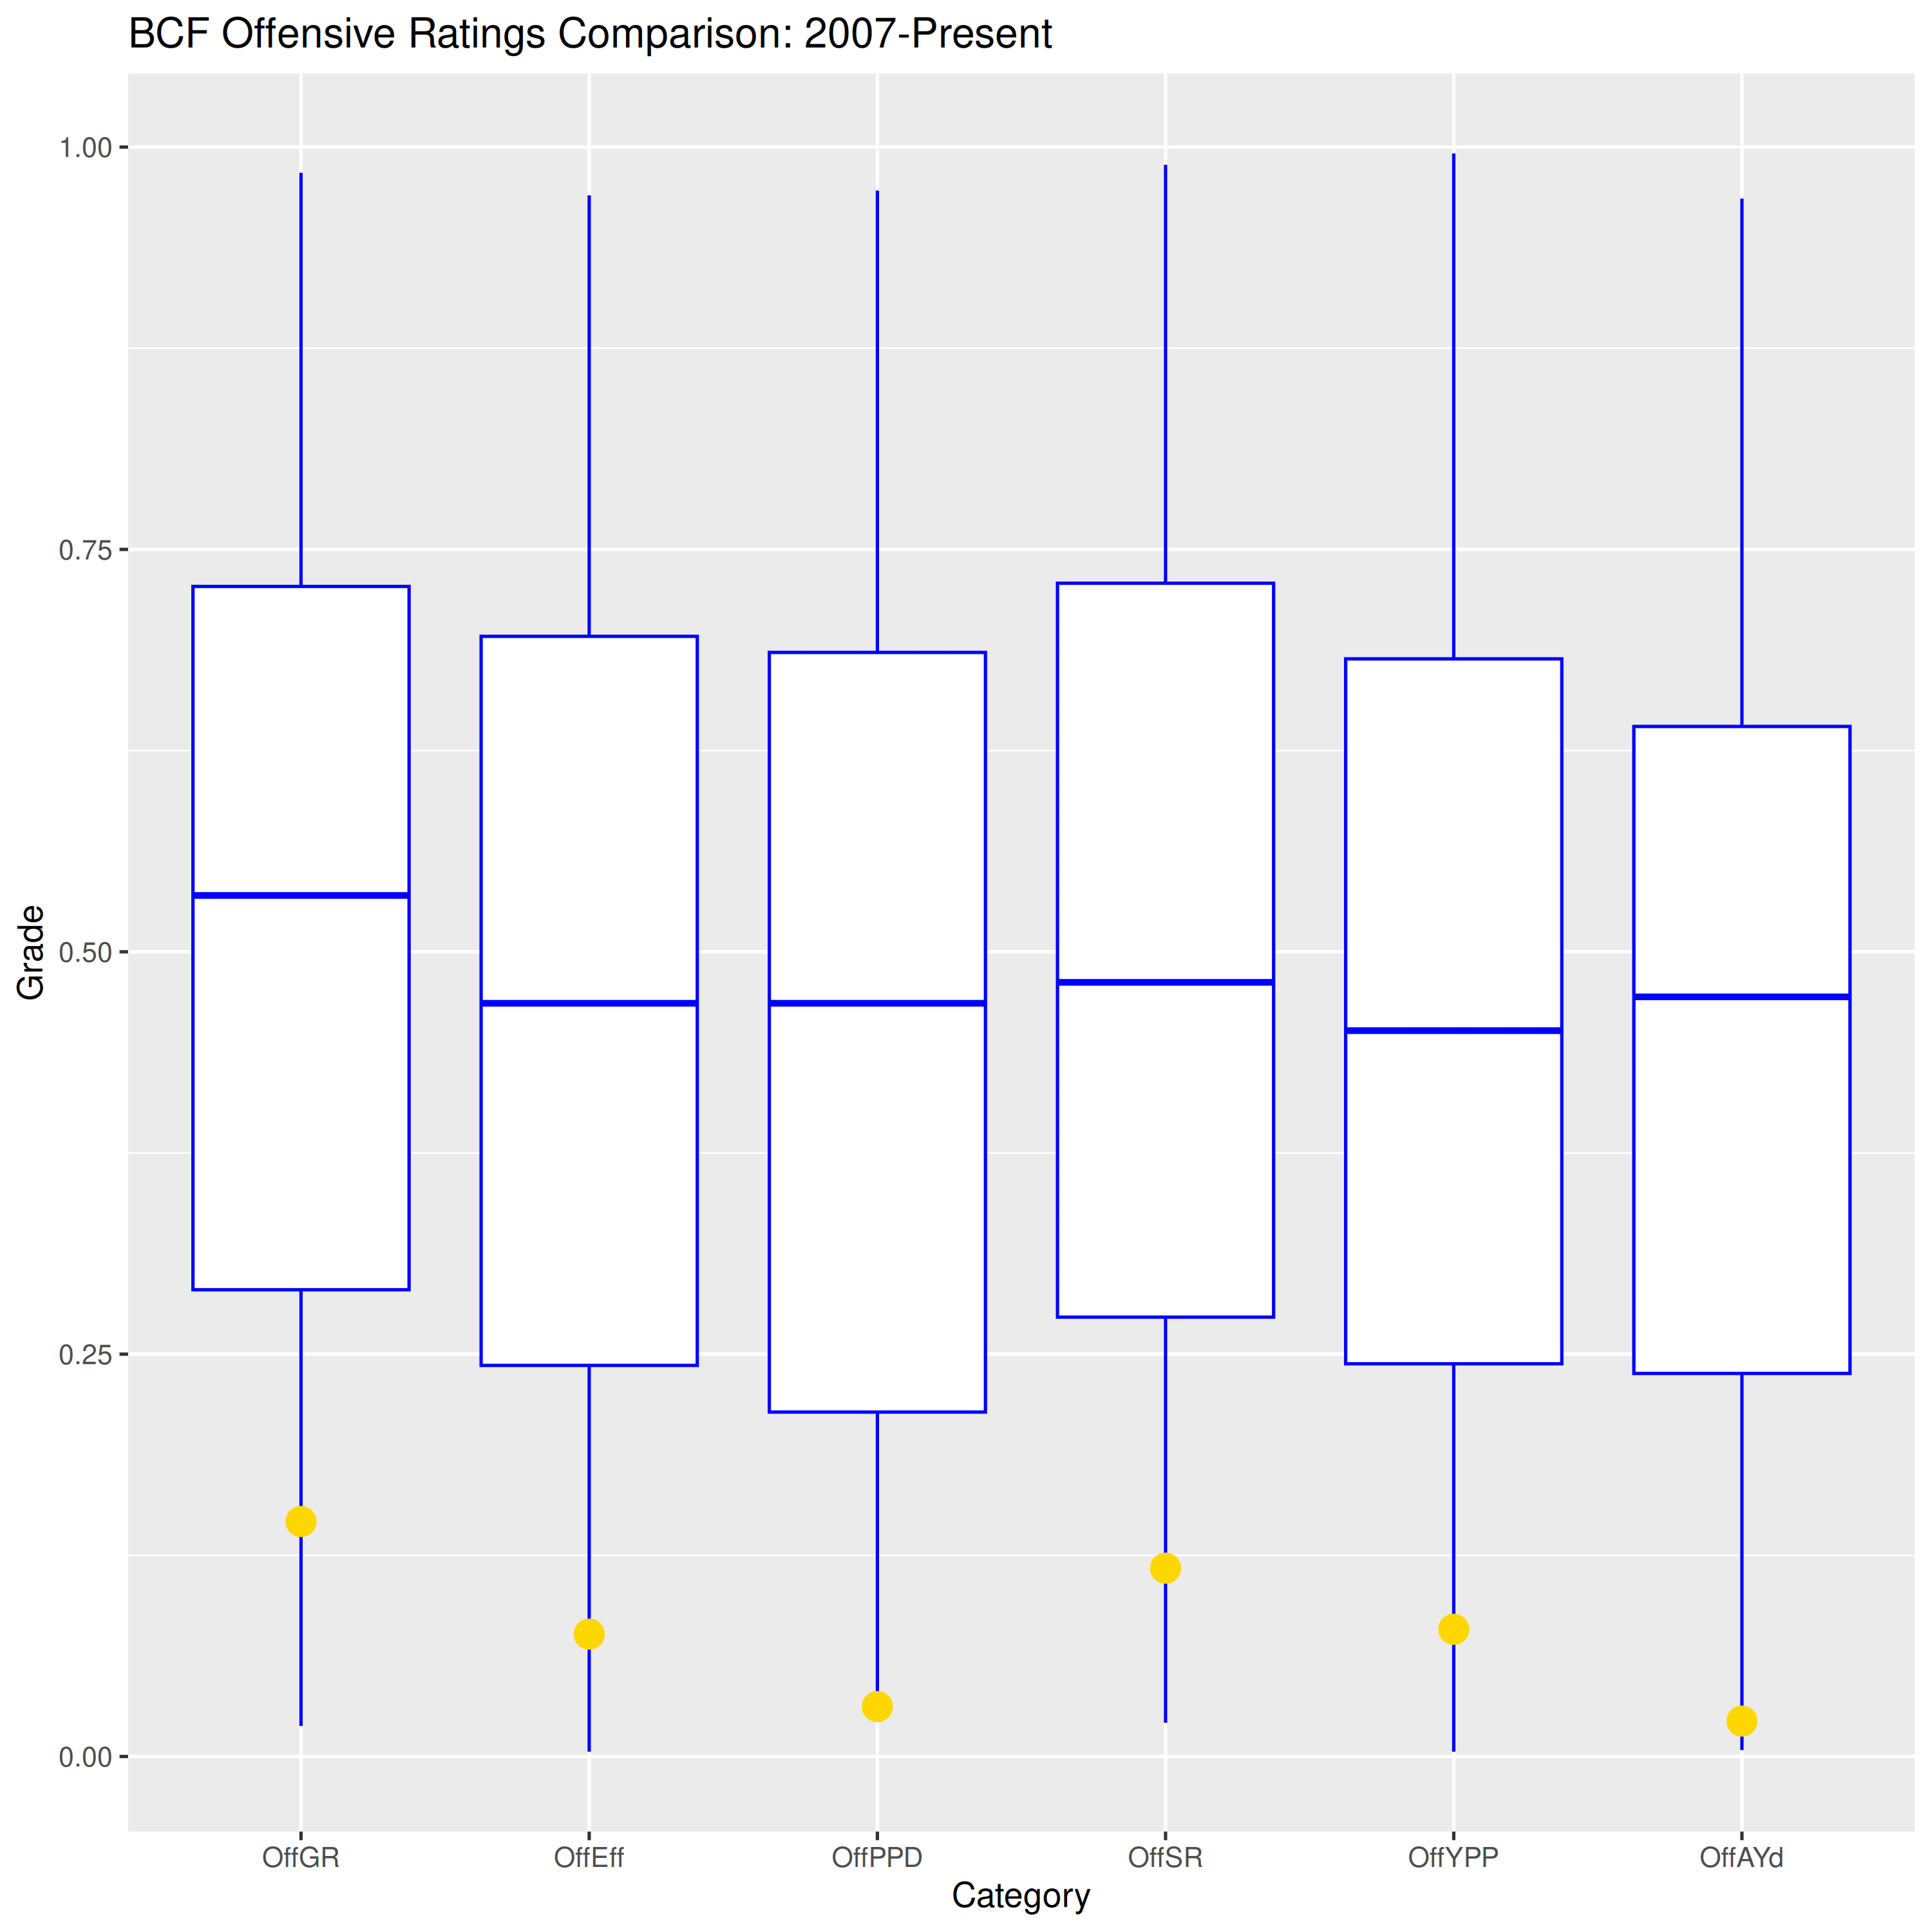
This is abysmal. Cal could not move the ball in aggregate or with any degree of efficiency, and they could not score. The only useful knowledge to be gained from analyzing this offense is that it gives us an opportunity to learn how BCF Toys calculates garbage time. It’s actually pretty simple and intuitive. Garbage time begins when Cal’s deficit > 8 x the number of remaining Cal possessions. At halftime Cal was down 34 and had 4 possessions over the remainder of the game. Since a 34-point deficit is insurmountable with 4 possessions, the entire second half was considered garbage time. I think this is the only game in our 20-season dataset where the entirety of the second half was garbage time.
Defense
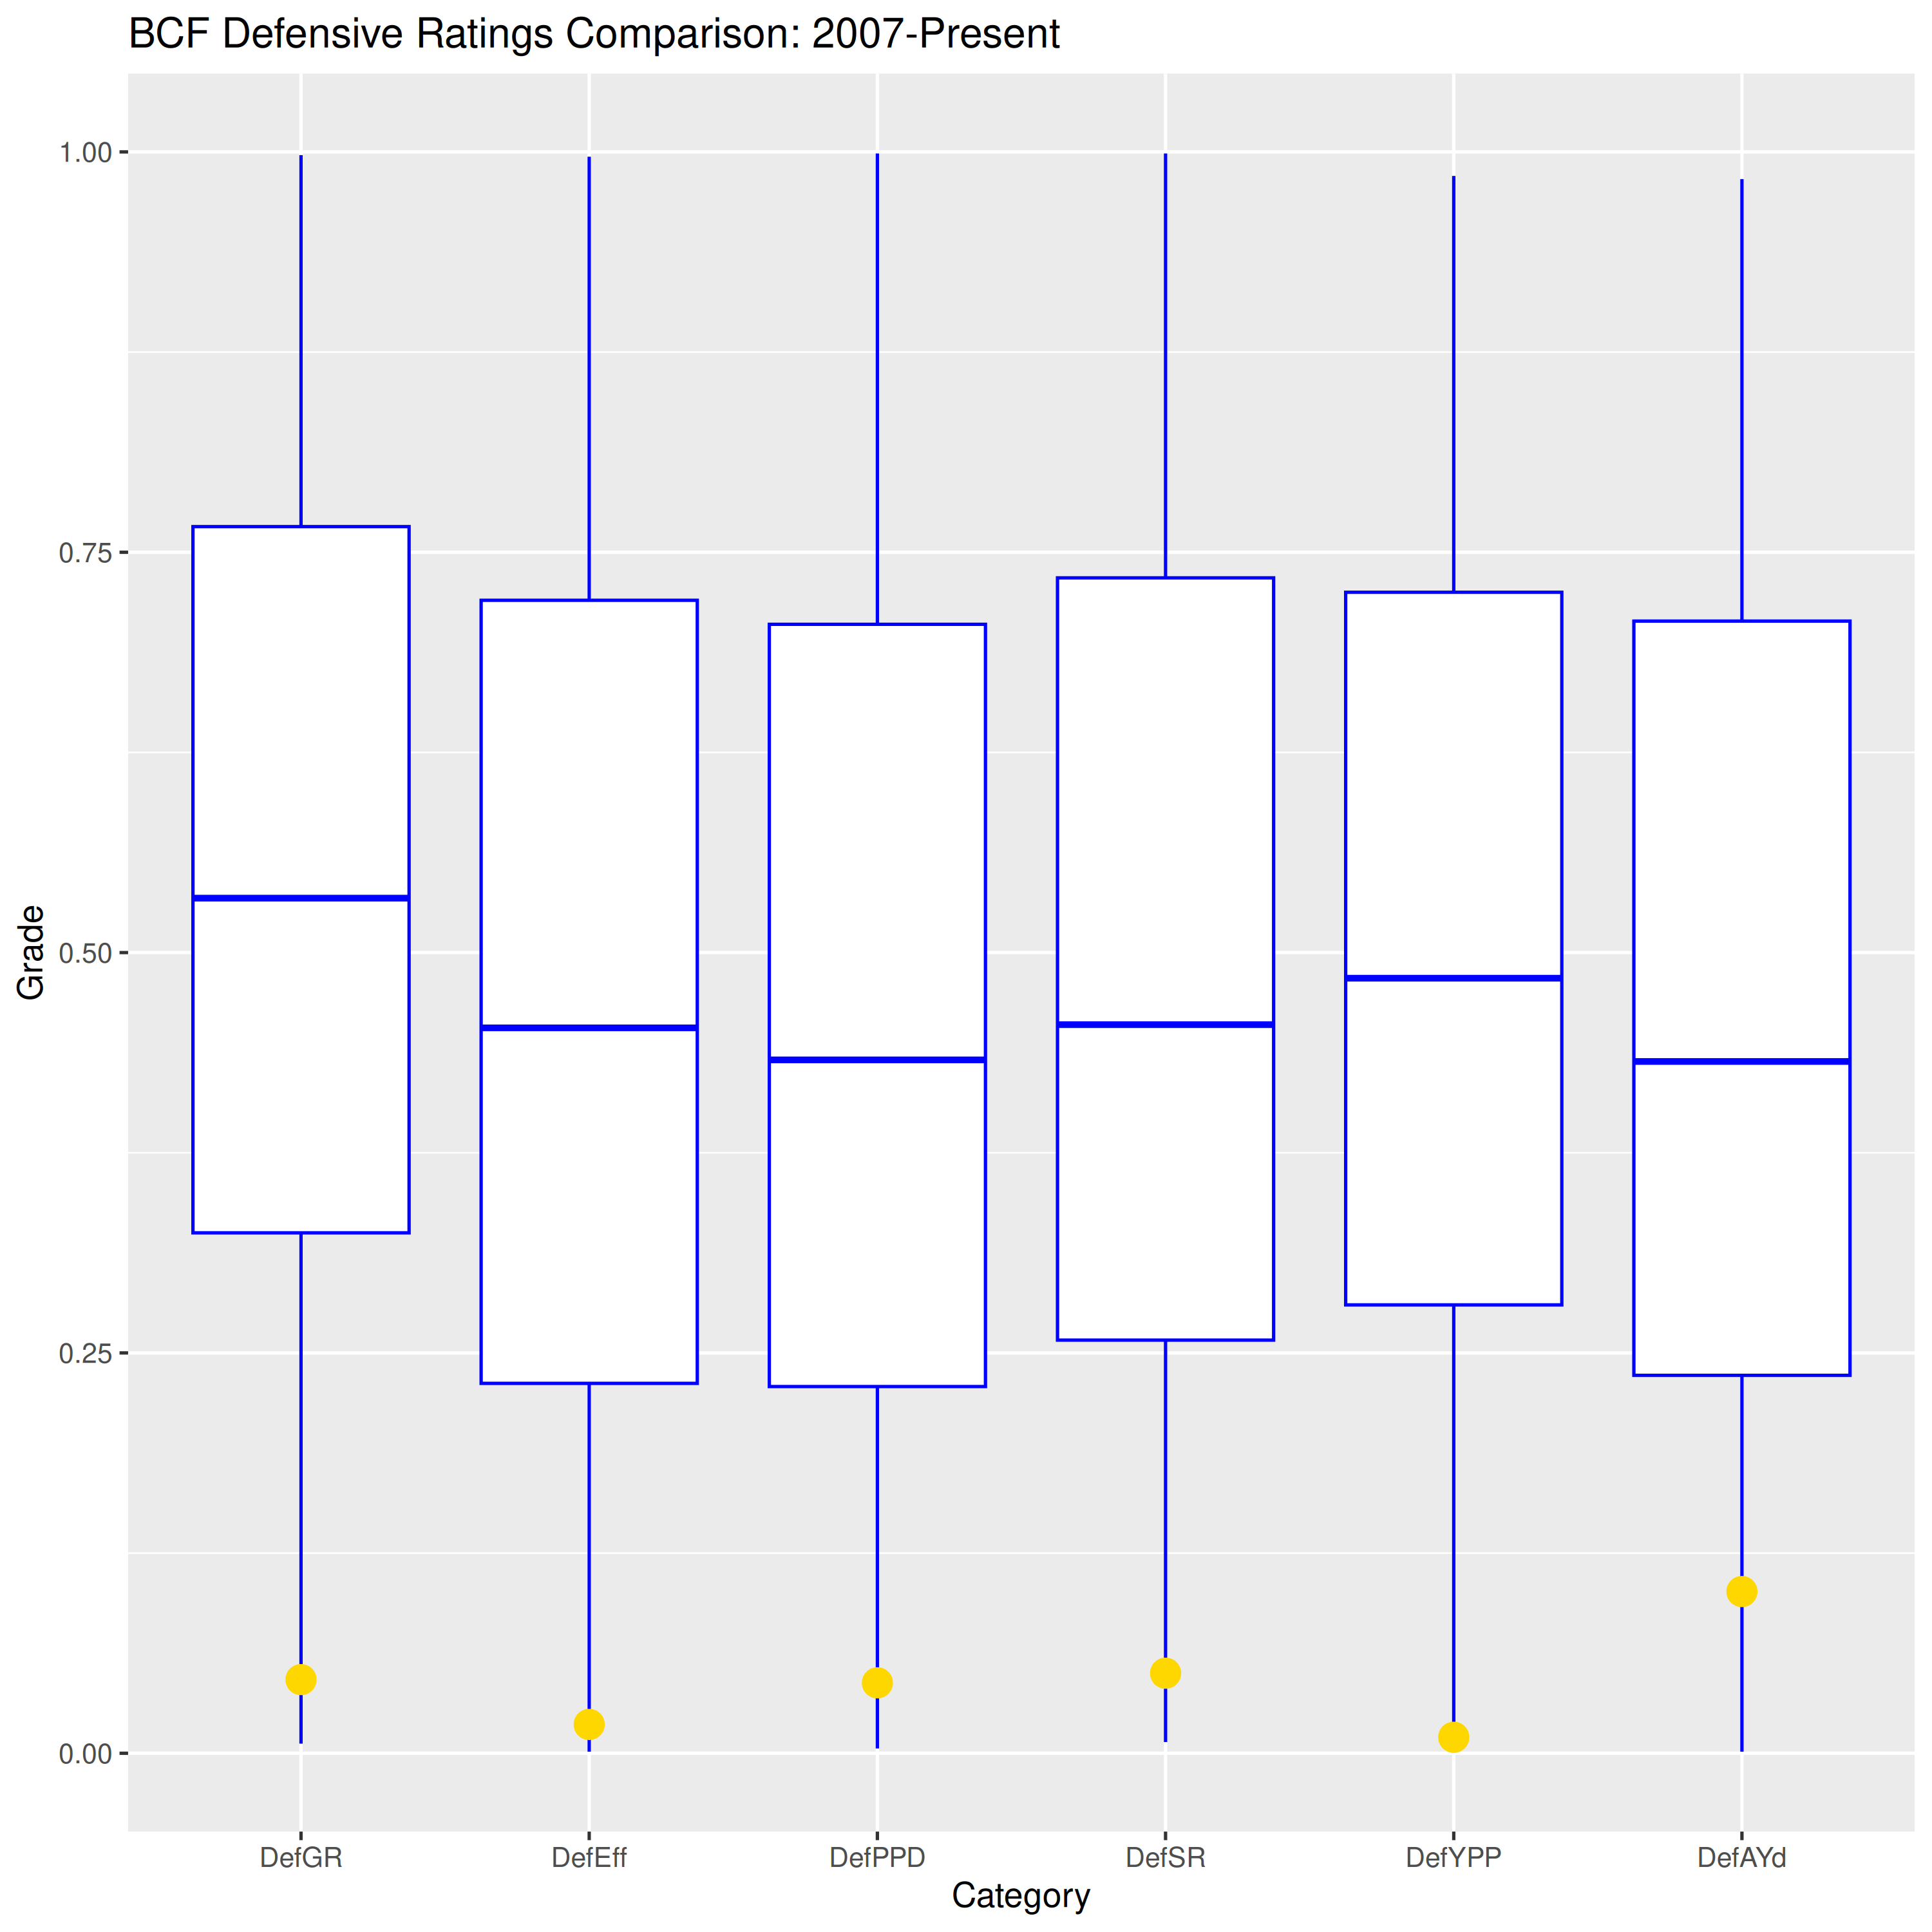
This is pretty much the opposite of the Cal offense: WF drove far, efficiently, and into the end zone with ease. Nothing about this defensive performance was commendable.
Special Teams
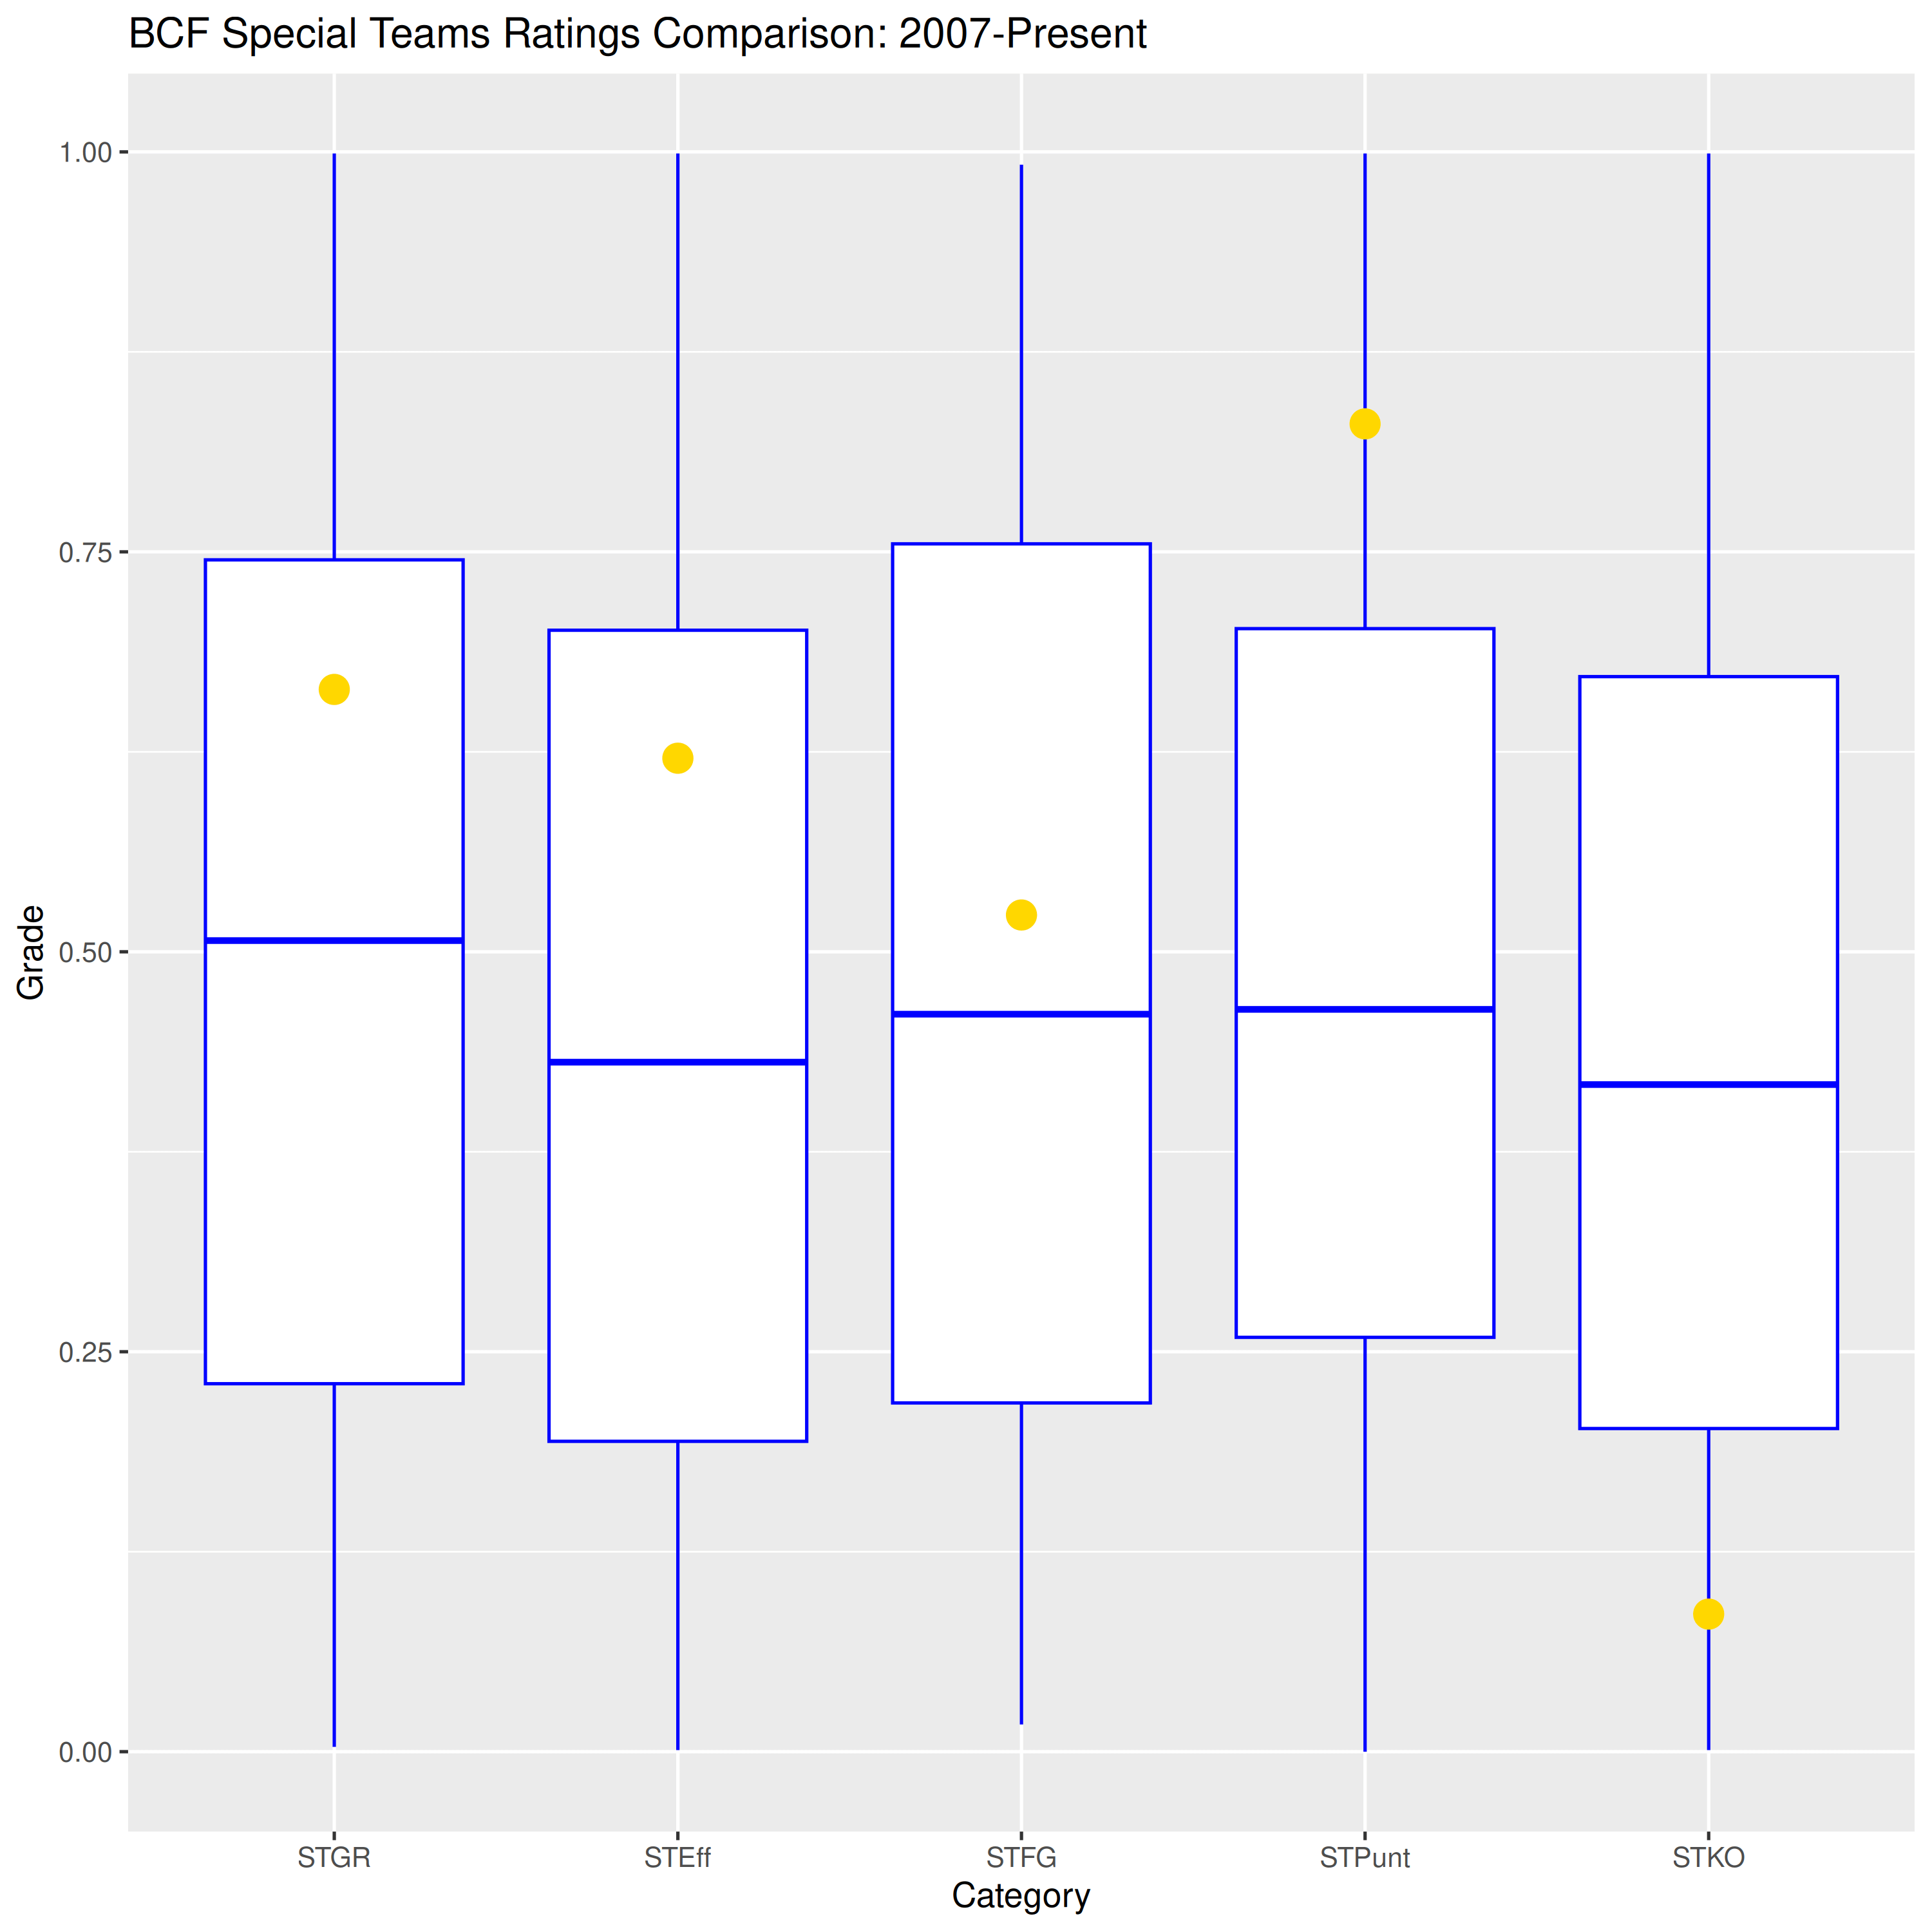
The only glimmer of sunshine peeking through the smoke from this raging tire fire was the special teams unit. It was generally a good day for special teams. Except when Cal tried to return kickoffs. I would be pleased if there were no more attempted kick returns for the remainder of the season.
Cluster Analysis
It should be abundantly clear where this one will end up…
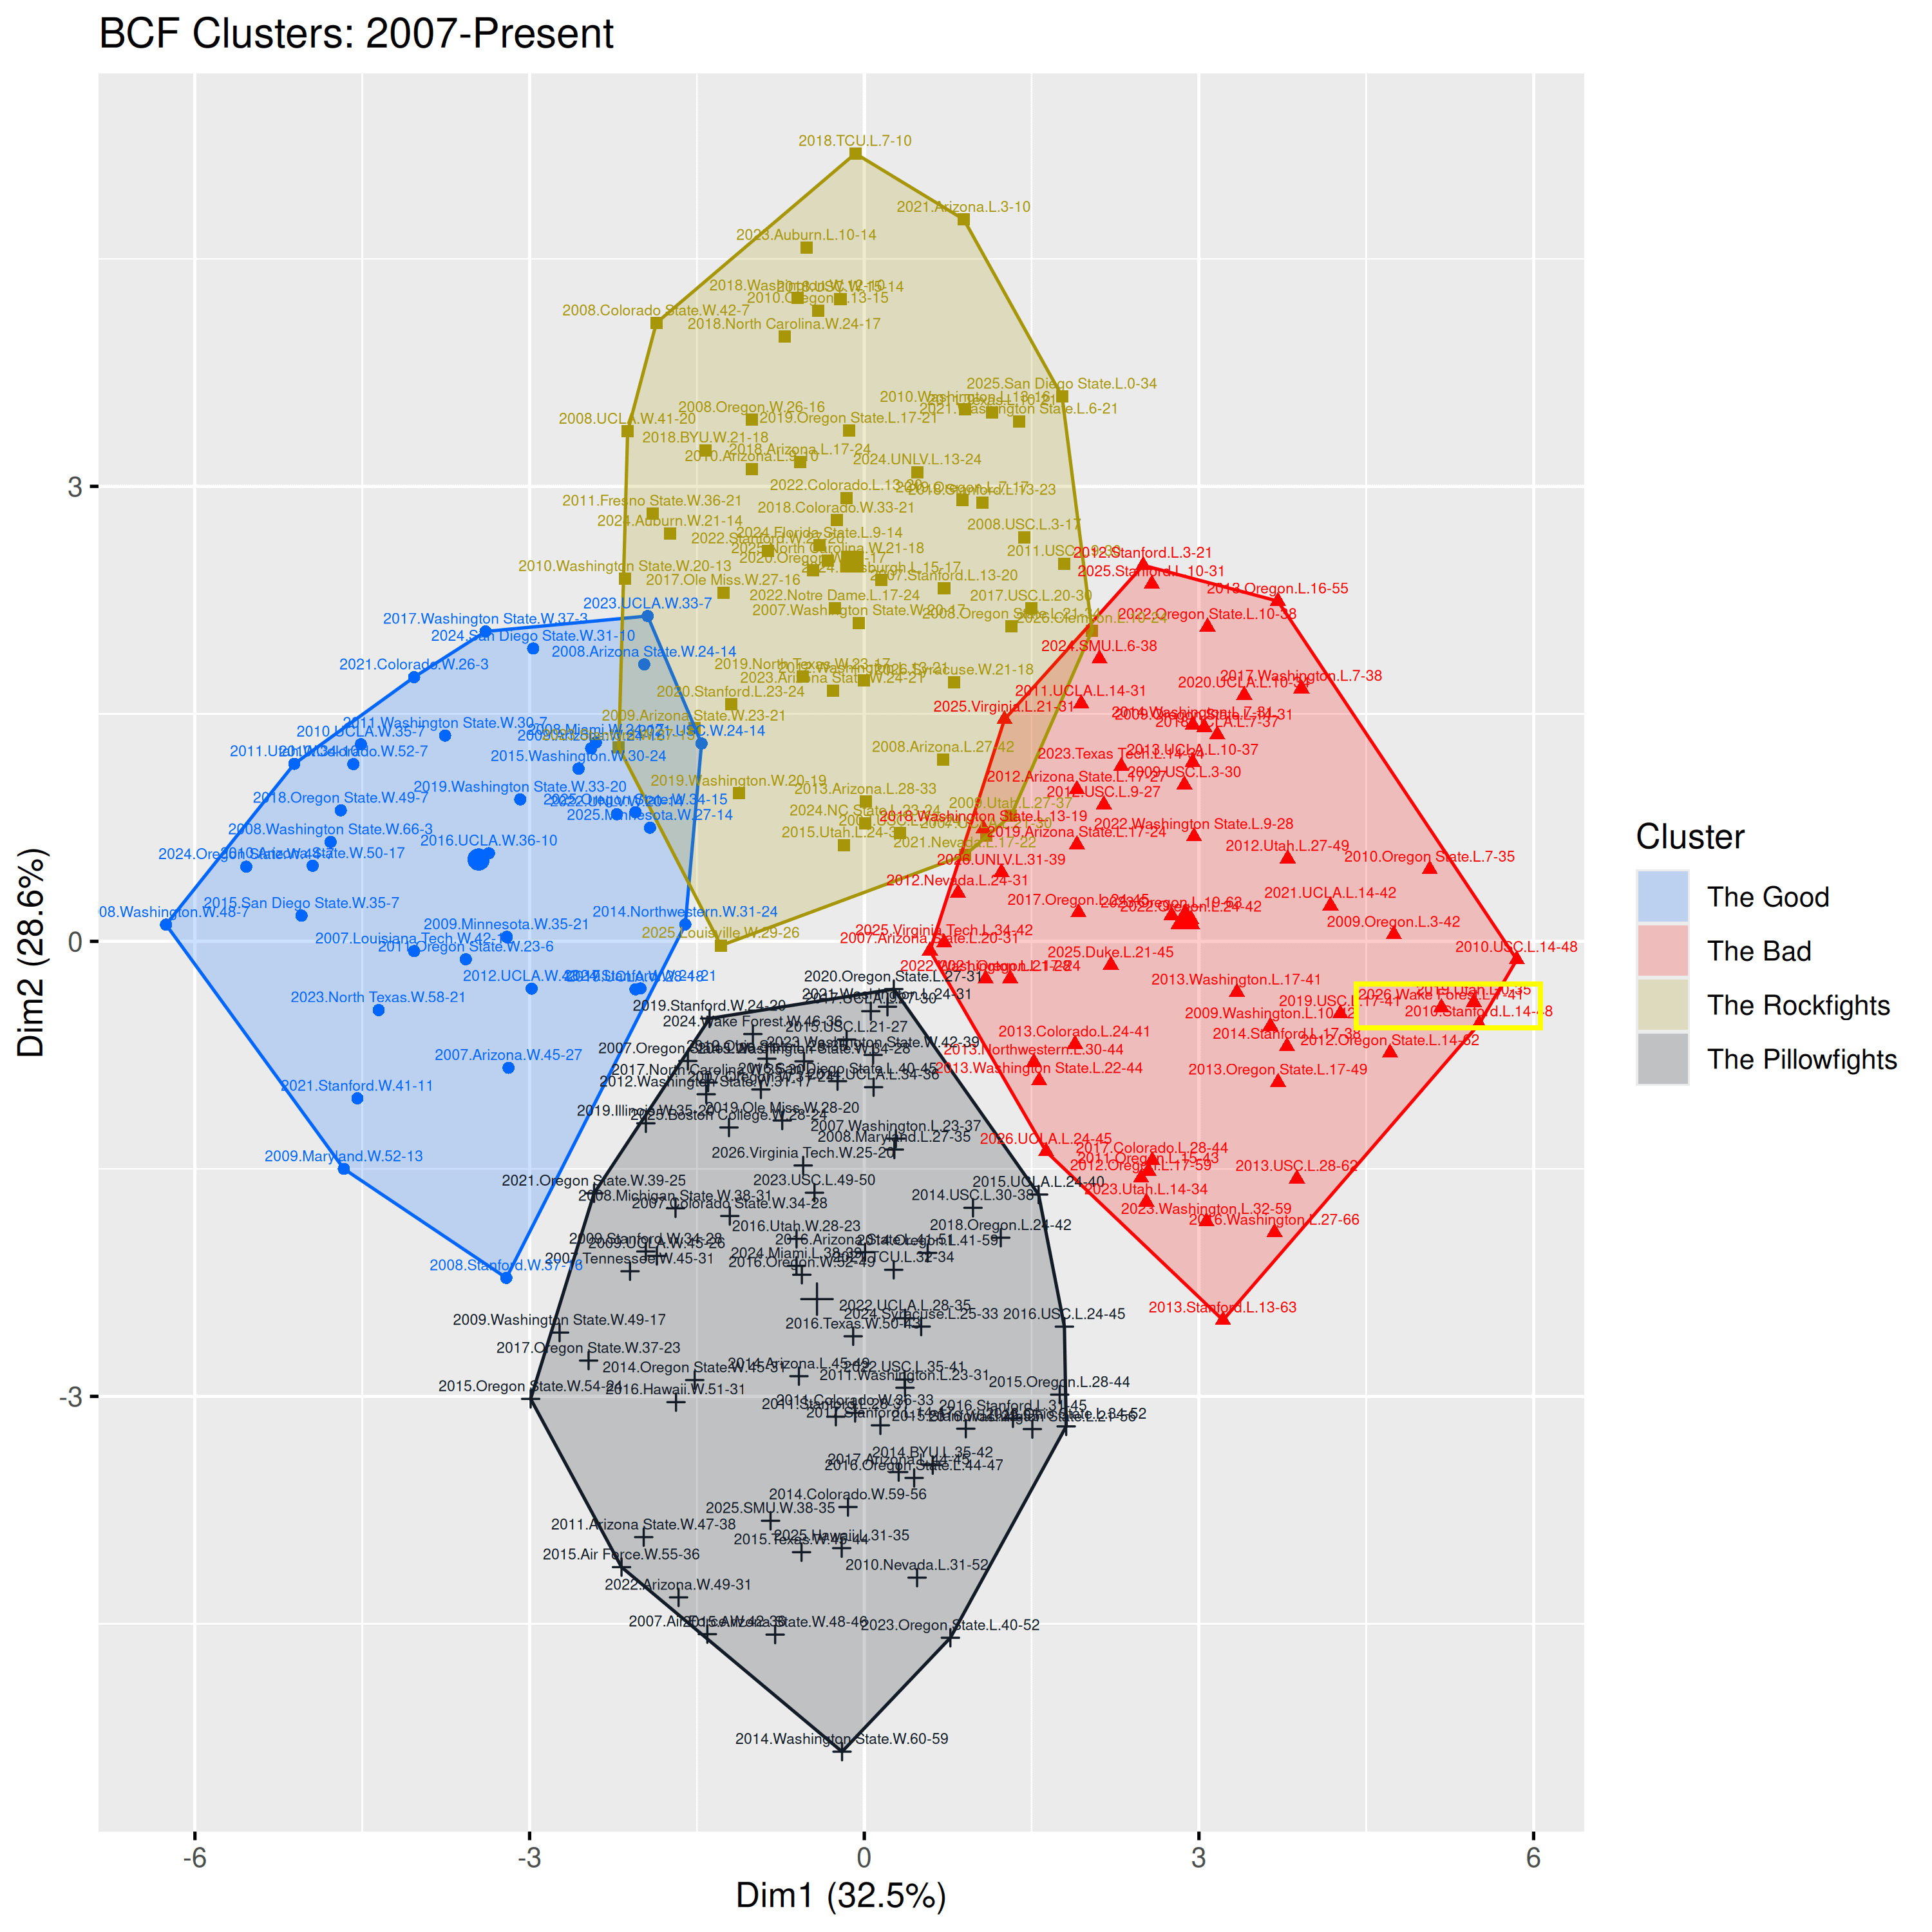
The Bad, once again. Not only is this in the bad, but it’s in The Sunken Place alongside the 0-35 loss to Utah in 2019 and the 14-48 Big Game loss in 2010. And yet, neither of those losses devolved into an entire second-half of garbage time.
Deja Vu
Out of morbid curiosity, I calculated which other game had the most similar profile to this one: Cal’s aforementioned 14-48 Big Game loss. Like this game, Cal was utterly destroyed by an extremely efficient QB who also punished the defense with his mobility. LSJU scored on their first eight possessions. Meanwhile the Cal offense was woefully unproductive and scoreless until their first drive of the 4th quarter, which was already garbage time. Like this loss, there was nothing redeemable about this performance (although Bryan Anger’s 54.3-yard punting average was pretty impressive).
I know it’s just one game and its a young coaching staff, but its exactly this type of disaster that lives rent free in every Cal fan’s head and prevents them from full-throated excitement about anything. Or maybe im just speaking for myself.
I really like how you found the good in that otherwise very bad game. The special teams did play pretty well, except as you pointed out, the kickoff returns. Why we kept doing that was very hard to comprehend.