

Hello and welcome to the first of hopefully many in our new Data and Analytics Series, Wurster Hall. Like Evans Hall, but a little more art and design focused, which as you’ll soon see is the primary focus of this series.
With our move to the ACC, I’ve been running a series over on Twitter introducing new fans to various fun facts about various universities we play!


I decided to step that up by looking at the analytical side of things, using math, numbers, and statistics, to explore and learn more about out opponents!
DISCLOSURE
Listen, Math always made sense to me as a kid all the way up until Calculus. Then I took Math-53 Multivariate Calculus for 3-days and decided you know what, Calculus is perfectly fine being in just two variables. Just after a year of switching majors from Math, I took Physics 8A and Stats 131A my junior year to satisfy some breadth requirements, barely passing both (C’s get degrees!).

With that, lets learn about UCLA through #data and #math! Welcome to Wurster Hall!
Wait, Your Stadium Is How Far Away?
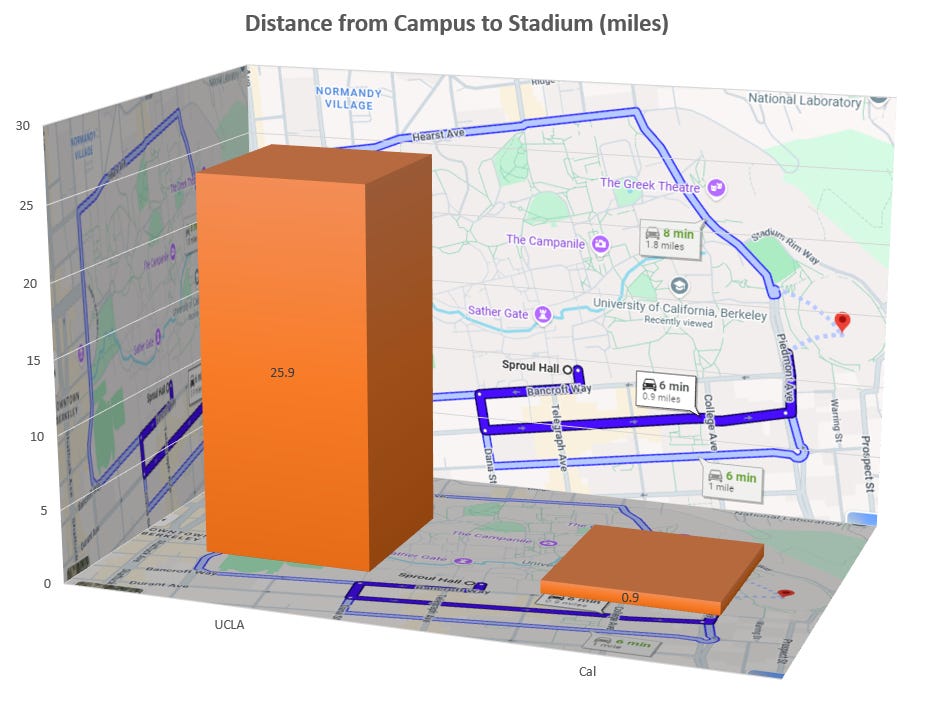
Our first data point, the relative distance of each campus to their stadium! Because who doesn’t have an on campus stadium? Did you know UCLA doesn’t own their own stadium? And they are actively trying to make that commute worse! What a university.
Fancy Seeing You Here
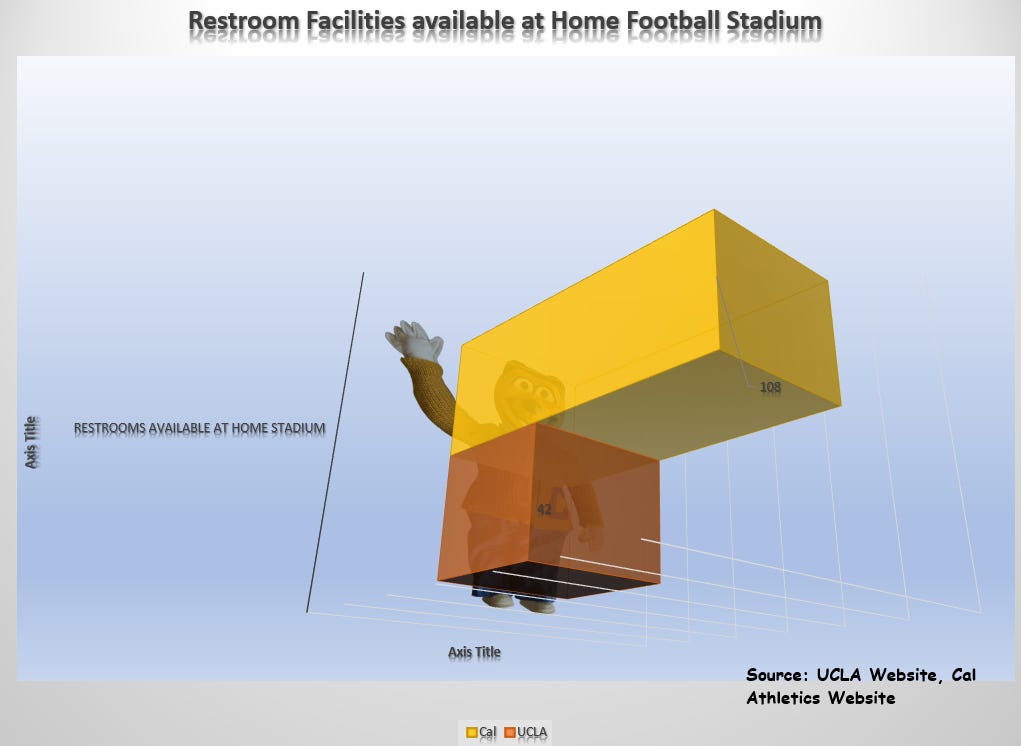
Our second data analysis looked into the number of restrooms in and around the stadium. UCLA and the Rose Bowl have a paltry 42 compared to the lofty 108 around Memorial Stadium. Admittedly, CMS is home to approximately 87 porta-potties on the East Side which come and go, but we count them because they are a sacred site in Calgorithm history.
Distance to Nearest Bear
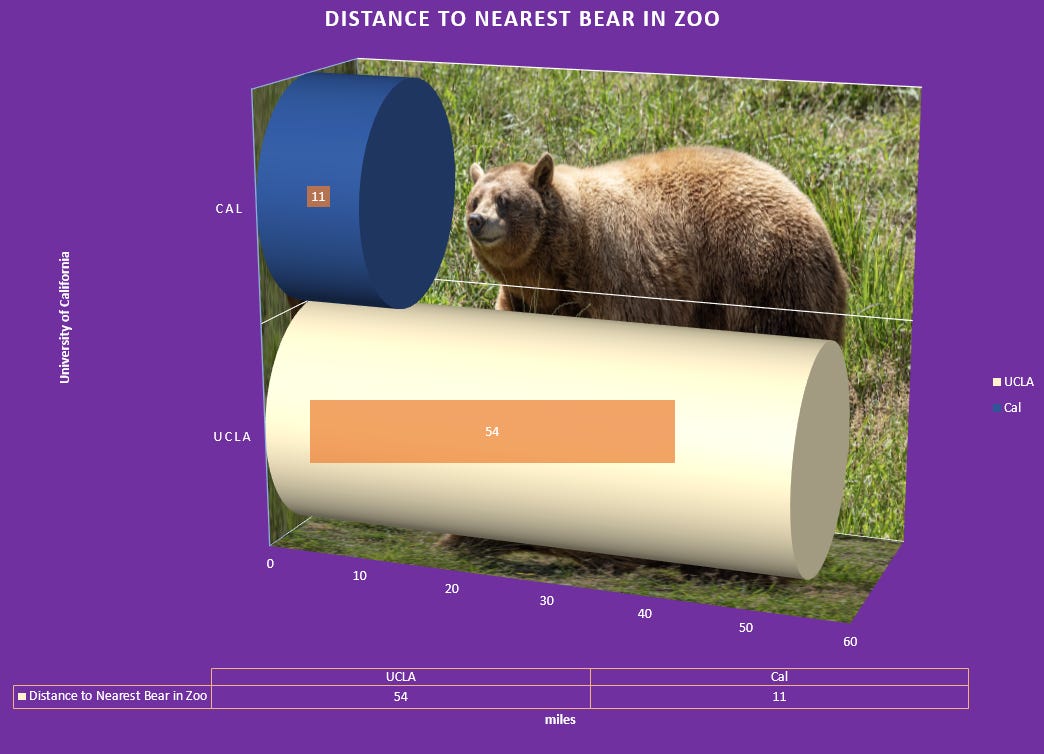
This next data point is sure to be one we refer to it a lot, the distance to the nearest bear from each university. Cal wins this contest by being close to the Oakland Zoo at around 11 miles while the nearest bear to UCLA is at the OC Zoo over 54 miles away.
WRITER’S RETRACTION
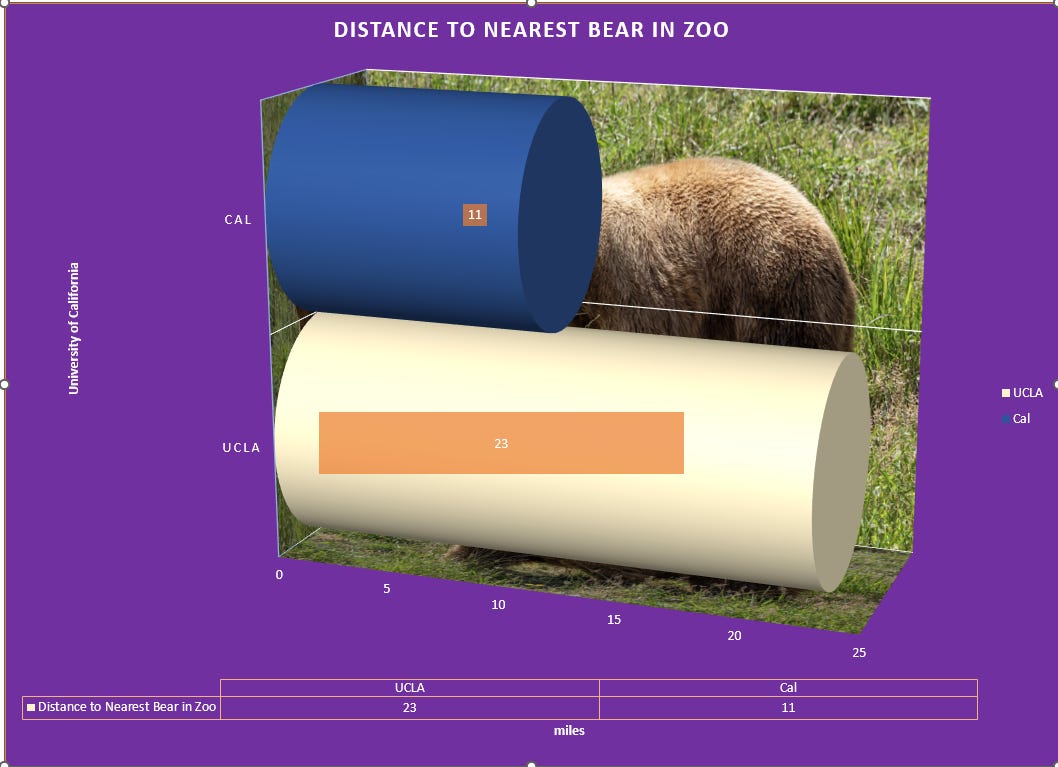
I apologize profusely. We here at Write for California got this one wrong as the LA Zoo has a new bear, changing our data. We have fired all the fact checkers associated with this graph, updated the graph, and will be seeking new fact checkers. Please enjoy this updated graphic to reflect the new data.
US News and World Report Rankings
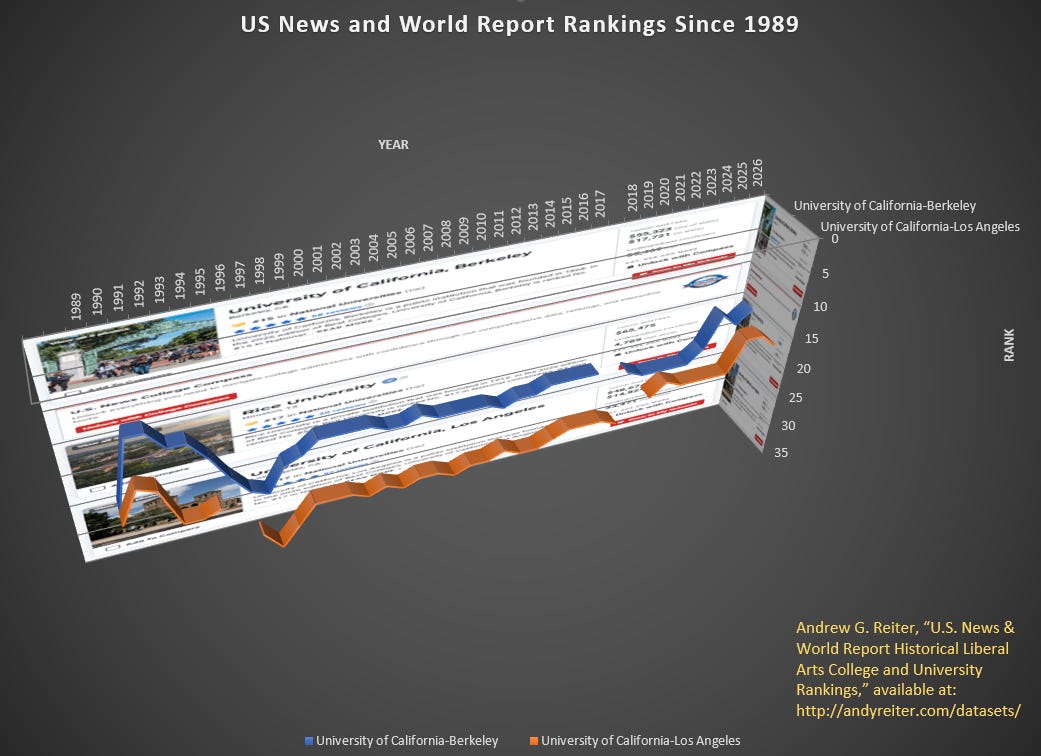
Next, an important dataset that Cal and UCLA fans alike both pay attention to. Visualized here is the US News and World Report Rankings dating back to 1989, courtesy of Andrew G. Reiter. There’s no need to pay attention to the numbers as the graph here shows that Cal has just about always been higher! Neat!
Slinging the Rock
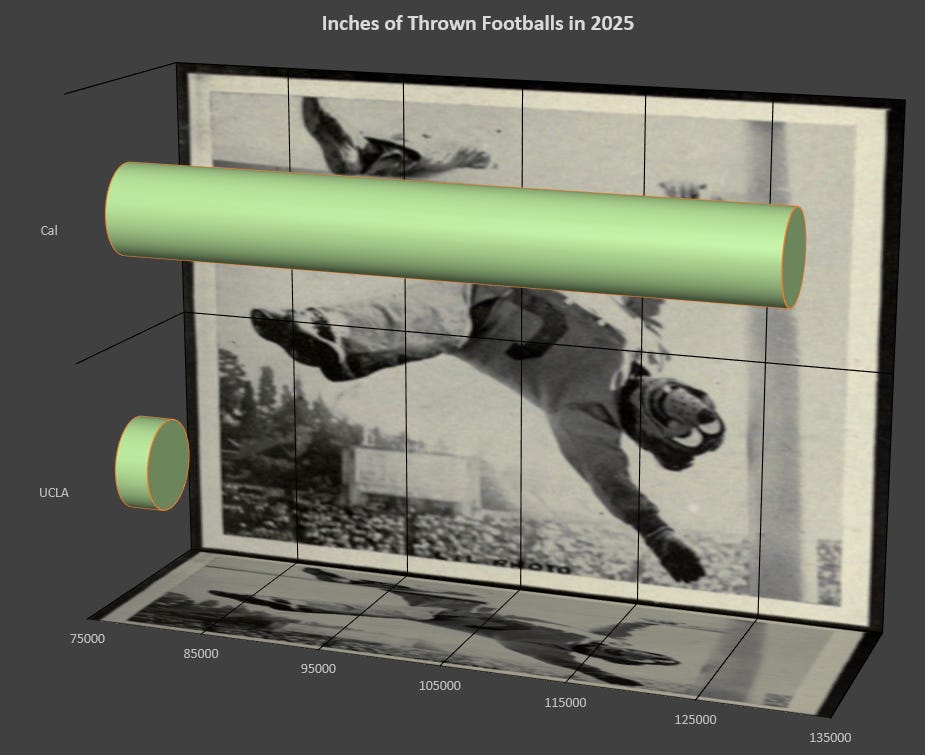
An important part of football is the ability to advance the ball, past something typically referred to as the first down line. Some teams opt to do this on the ground by running the ball, or “the rock” as some fans will call it. Then, in 1906, someone invented the forward pass. Some schools like Iowa are still trying to figure it out. Statistically however, UCLA and Cal both like to throw that good good rock around. Our data above, measured in inches, shows just how far both teams through the ball around last year.
A, B, C, D…
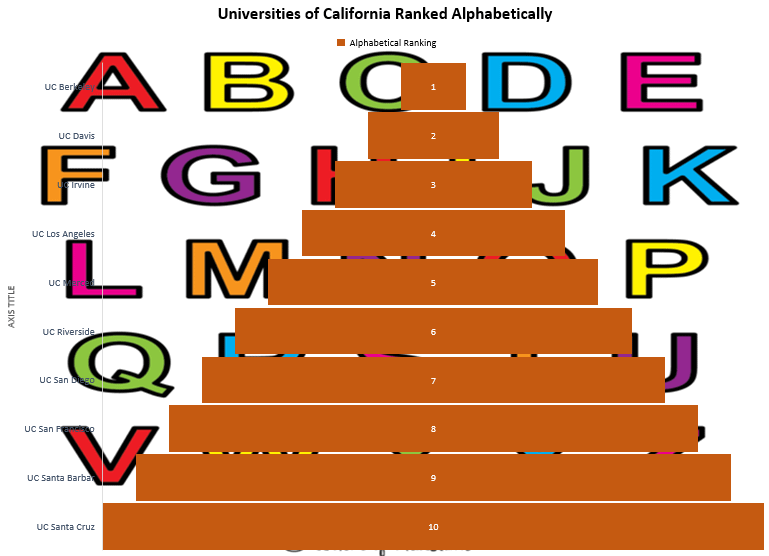
Next, we take a step back here and look at the entire University of California system and how they rank alphabetically. We start at the top of course with #1 UC Berkeley, and interesting UCLA can’t seem to crack anywhere higher than #4, followed closely by UC Merced. Honestly this alone warrants flagships status for UC Berkeley.
Wikipedia Standings
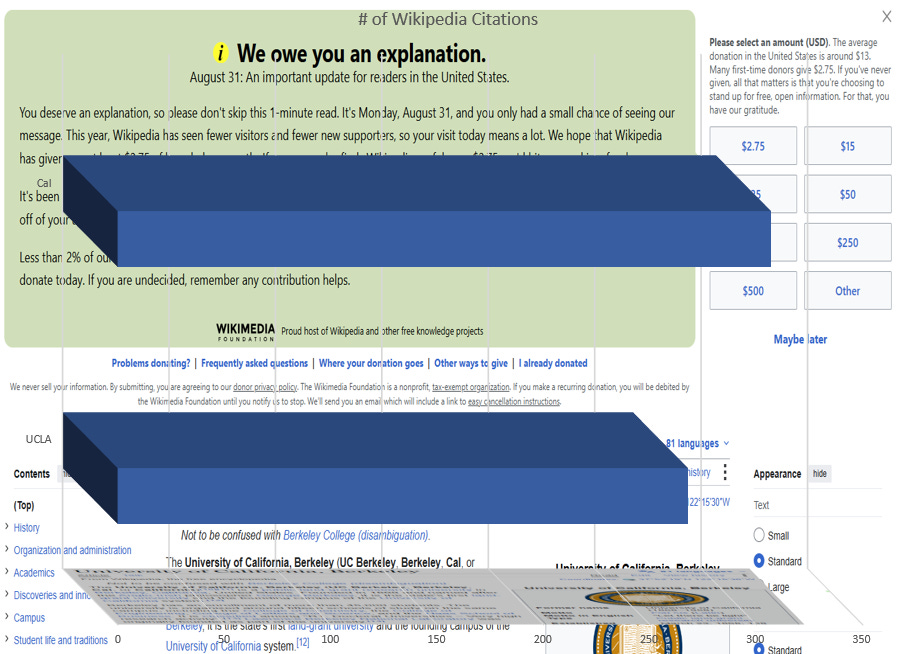
Going through school, every single teacher told me “You can’t cite wikipedia! That’s not a reliable source!” Well I showed them, using wikipedia for just about every single data analysis here! So how better to compare the two universities than to see which one has more references? UC Berkeley wins again just over 300!
Conference Championships
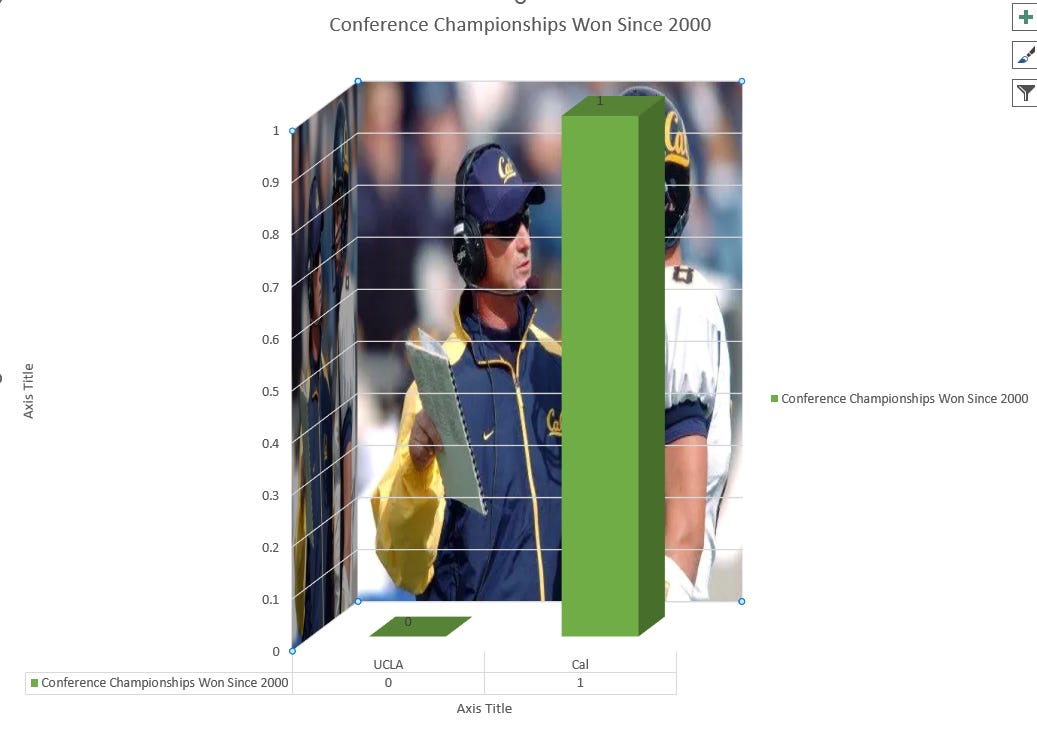
Another important data point to consider when evaluating a program’s health is how many conference champions have been won since say, the early 2000s. In this regard, the data is pretty conclusive on who is the better team.
City Nomenclature Length

Another important data point is to consider how long each name of the city the university is located in is. Which when you break it down by letters, there are 8 in Berkeley. B is 1, E is 2, R is 3, K is 4, E is 5, L is 6, E is 7, and Y is 8. On the other hand, Los Angeles has 1. L is 1, O is 2, S is 3, A is 4, N is 5, G is 6, E is 7, L is 8, E is 9, 10 is S. So unfortunately, Los Angeles is slightly longer at 10 while Berkeley is shorter at 8. And 10 is bigger than 8. However, Berkeley is efficient, using only 6 unique letters while Los Angeles uses 9 unique letters. Who is to say which is better (It’s Berkeley.)
And with that, we’ve learned everything we need to know about UCLA! That’s all the statistics! The brain trust here at me appreciates you taking the time to read this. We hope to make this a recurring series as we seek to learn more and more about the fascinating world of data, analytics, data science, and our favorite universities.
Come here for the best writing on Cal football. Stay here for the sophisticated and compelling visual data analytics!
Geez, what a relief. Now that I know these essential data points I can climb down out of the first game of the season anxiety tree and walk upright, more or less. Thank you so much for the reset!