Evans Hall: Retrospective on Cal Football Offense, Part 1: Data, Charts, et al.
Consequentialist Look on Big Picture Overlook of the Offense
Do you know what makes for a great review of the college football season? Numbers and charts. Yes, this former consultant and research officer will entertain you with data that usually is hidden in the “statistical appendix” that 5 people ever read, one of them being the editors.
Dear reader, you’re in luck! I open the retrospective with some notes:
The dataset contains play-by-play data for all FBS level plays for 2021.
Play-outcomes have had penalties, end-of-periods, punts, and kick-offs removed.
EPA/PPA comes from the measurement of how efficient a play was in increasing the chance of scoring.
It comes from EP (Expected Points) where each spot on the football field is given a value that approximates the expected points an offense can get from there.
The Big Picture
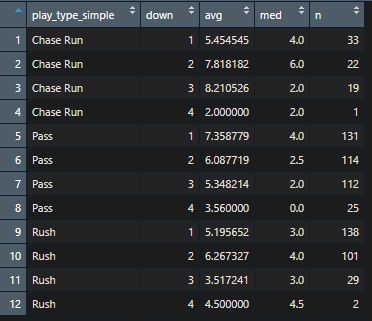
We can see here that Cal was a pass-heavy offense with the average skewed by big plays through the air with a median outcome of 2 yards. Chase runs/scrambles remained consistently the best plays we had on offense.
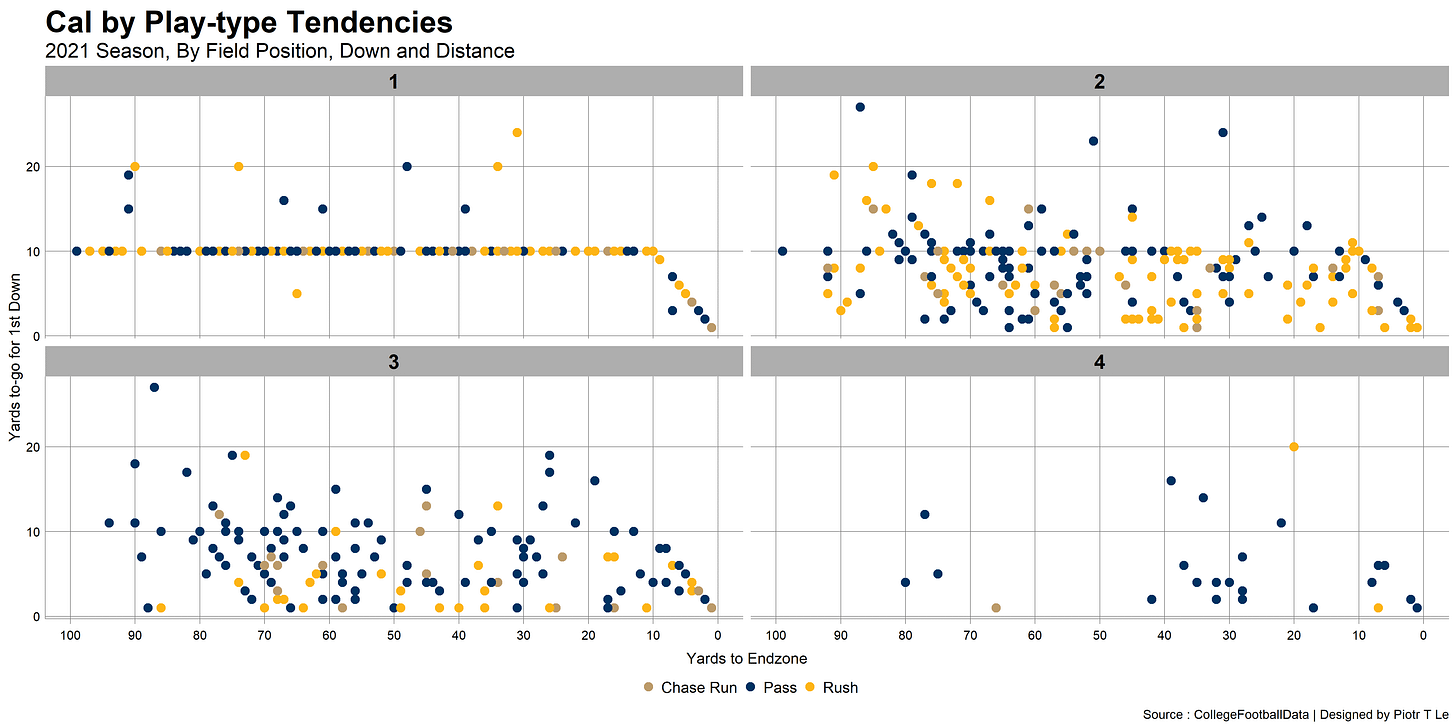
This dataset is capped at 25 yards gained to focus on 96% of the Cal plays. (Cal had 29 plays of >25 out of 727). Overall, this is an expected distribution of outcomes, with a lot of the plays in Cal 25-35 territory (75-65 on the x-axis) due to the fact that Cal would often stall out in their own territory. With a balance of run/pass on 1st and 2nd down and pass-heavy 3rd downs. The propensity to throw on 3rd down especially, regardless of the location of the ball or the distance needed. Another thing worth noting is that the closer the offense was to the red zone the more often Chase would take it himself.
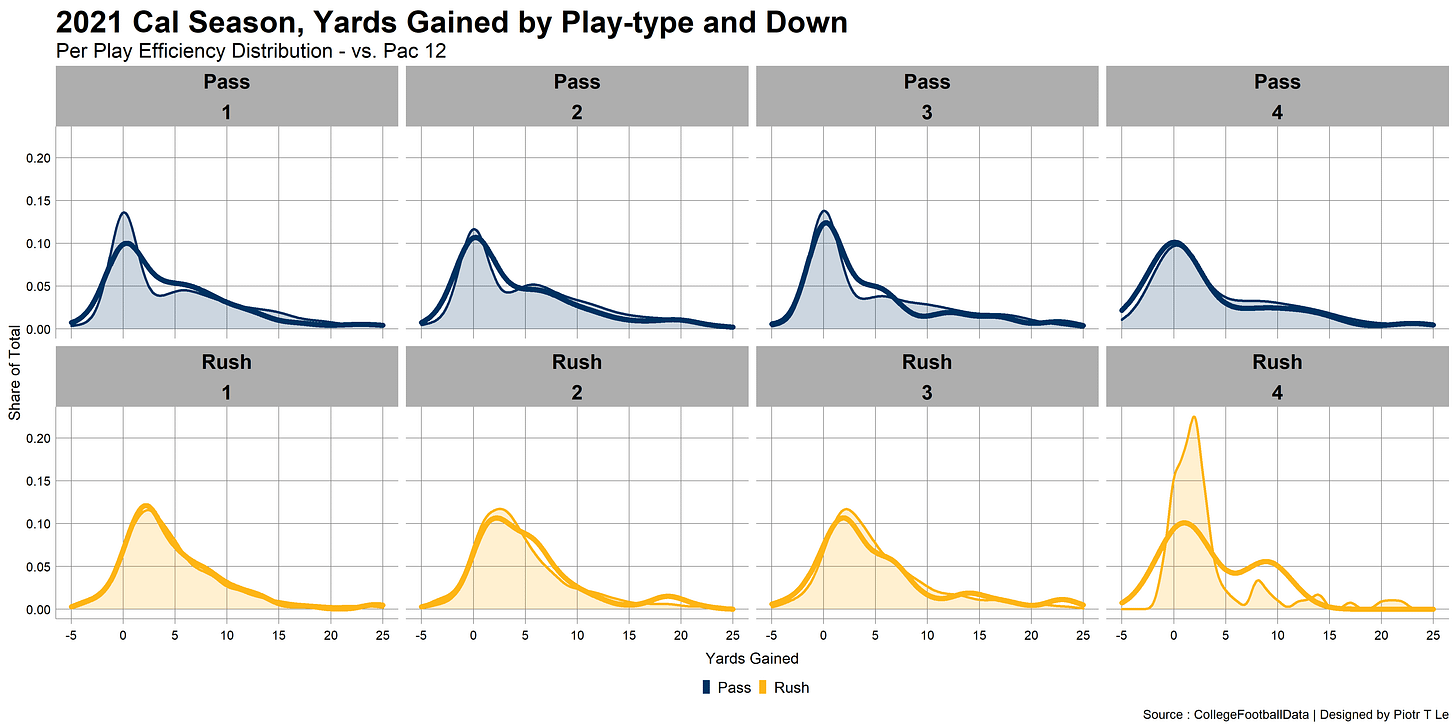
Above we can see Cal’s (thick line) outcomes plotted over the Pac-12 trends (shaded area). We can see here that Cal was the average Pac-12 offense (which let’s not forget includes the historically bad Arizona and Colorado offenses). It isn’t much different from a consequentialist perspective: We were very average in the Pac-12 despite boasting a senior core of players who have played together and in the system before. That’s not good.
Here you can see the splits of play-calling by down and play-call as well as the frequency of the play call on each down. We can see here we have been a balanced offense on 1st and 2nd down, the avg. yards gained are relatively similar, even with medians meaning the distribution is overall similar.
The “Money” Down
The big deviation is 3rd down: we become a pass-first offense in those moments. 3rd downs have always been the defining down where the offense leans on their strengths. And this indicates that the Cal offense is defined by Chase Garbers and his play.
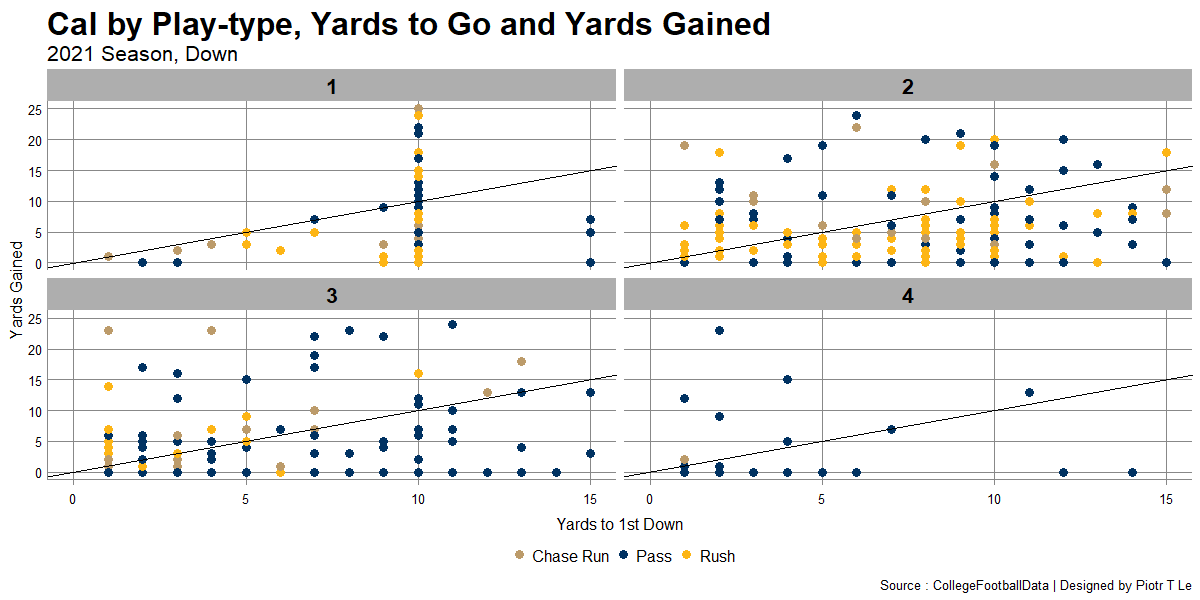
Here we have the data plotted over the yards needed for the first down, the down, and the outcome. We can see here at unless the ball is on the 1, the offense runs through Chase on 3rd down irrespective of the distance or historical outcomes. There were questions raised by the guys on Golden Bearcast about what the calling card of this offense was, the answer is and was that this is a QB-centric offense where the nature of the verbiage and the balance of the play-calling put pressure onus of the offense on the QB.
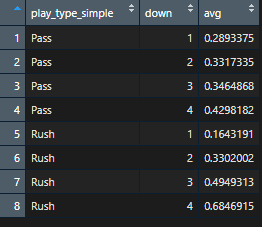
Above is the 1st down conversion rate by play and down called. We can see here that Chase’s runs were crucial in keeping the chains moving especially on 3rd down in non-3rd and short situations. The offense struggled to convert on early downs setting Cal up on uncomfortable 3rd down situations.
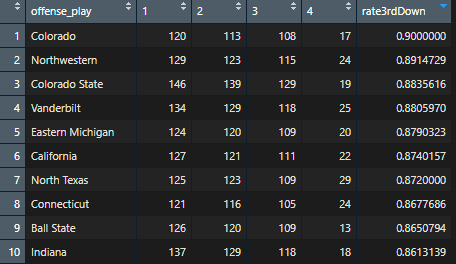
Compare the above Cal chart to see that compared to the CFB avg. the offense was not doing its due diligence on early downs to prevent 3rd downs. To add to this value, in 127 total drives by the Cal offense 111 of them had a 3rd down for a 87.4% rate, which is way higher than the national avg. of 80.4%.
Above we see a sample of all FBS teams with >100 drives in 2021, Cal is 6th worst in the nation in the % of drives with 3rd downs in them. This is why the offense felt lumbering at times, drives didn’t have the tempo of consistent down conversions on early downs, but had to take time to run plays after plays after plays.
Football Outsider Detail Data
Continuing the theme of deep data dives about offensive production. We can see that all of the above data points indicate a very wasteful offense that couldn’t get out of its own way. The low touchdown rate per drive is more striking if you consider the roughly 70% touchdown rate Cal had early in the year on their first two drives, quantifying the drought we saw on offense in the mid to late stages of a game.
Thoughts
In this part, I looked into the offense as a whole and focused on 3rd down and some other efficiency indicators. It leads us to some consequentialist conclusions:
We are a QB-centric primacy of the pass offense, which makes sense considering the system and freedoms it provides.
The outcome of this system is a mid-line Pac-12 offense that didn’t have outcomes in line with expectations.
One of the reasons it was hard to watch the offense for Cal fans was due to the fact that rarely did the offense not encounter a 3rd down indicating poor efficiency in converting on early downs.
This inefficiency is evident in advanced statistics.
In part 2, I will present Cal’s offense in contrast to the Pac-12 and the CFB at large on a play-by-play and overall performance. It’s going to go into a more outcome-based analysis than anything. Part 3-4, I hope will be more a process based look at what was the 2021 Cal offense.




Run the ball better and we will be fine.
Very eye opening stuff. That chart that shows where Cal ranks on drives that have third downs is a who's who of bad and boring teams. Colorado, Northwestern and Vanderbilt were not in a neighborhood where you wanted to reside last season. Cal gets to a lot of third downs due to boring, predictable and conservative play calling by a head coach who thinks he is still at Wisconsin. Maybe it's the real reason attendance has been falling. I went to bed at halftime of the USC game. Just didn't care to watch the end for the first time in 35 years.